 8
8peptides
spectra
0.000 | 0.000
0.000 | 0.000
0.000 | 0.000
0.007 | 0.033
0.000 | 0.000
0.000 | 0.000
0.844 | 0.870
0.099 | 0.138
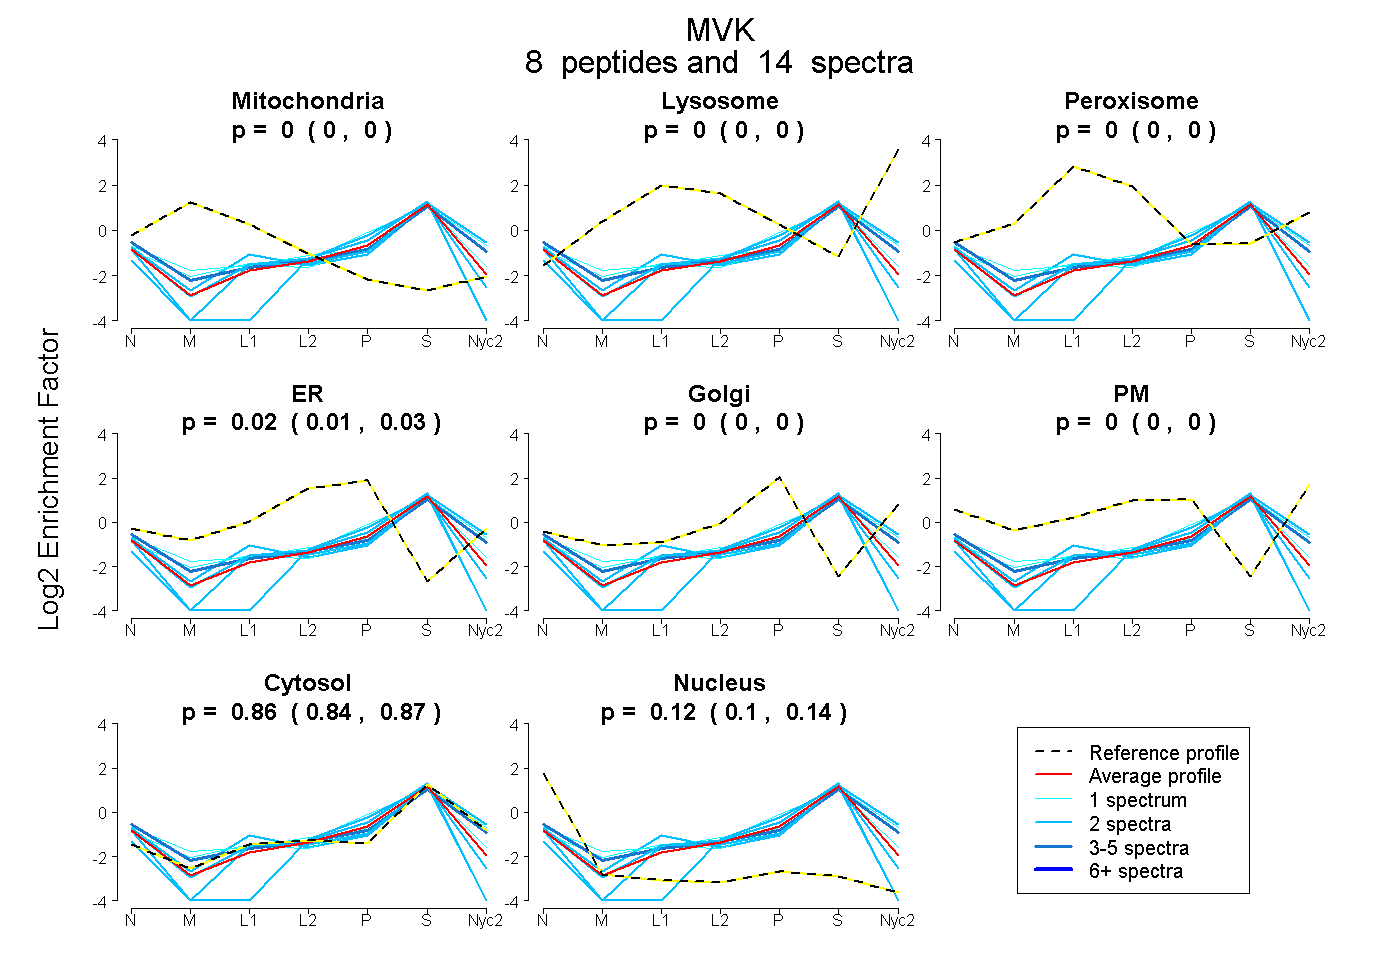
| Plot | Mito | Lyso | Perox | ER | Golgi | PM | Cytosol | Nucleus | |||||
| Expt A |
8 peptides |
14 spectra |
|
0.000 0.000 | 0.000 |
0.000 0.000 | 0.000 |
0.000 0.000 | 0.000 |
0.022 0.007 | 0.033 |
0.000 0.000 | 0.000 |
0.000 0.000 | 0.000 |
0.858 0.844 | 0.870 |
0.120 0.099 | 0.138 |
| 1 spectrum, MLSEVLLVSAPGK | 0.000 | 0.000 | 0.000 | 0.000 | 0.056 | 0.000 | 0.897 | 0.048 | ||
| 2 spectra, VIHGNPSGVDNSVSTWGGALR | 0.000 | 0.000 | 0.000 | 0.000 | 0.000 | 0.000 | 0.807 | 0.193 | ||
| 1 spectrum, LTGAGGGGCGITLLKPGLER | 0.000 | 0.000 | 0.000 | 0.127 | 0.020 | 0.000 | 0.805 | 0.049 | ||
| 1 spectrum, TFLVLRPQSNGK | 0.013 | 0.000 | 0.000 | 0.000 | 0.024 | 0.104 | 0.840 | 0.020 | ||
| 2 spectra, GSIGSWPEEDLK | 0.000 | 0.000 | 0.004 | 0.000 | 0.000 | 0.000 | 0.836 | 0.160 | ||
| 2 spectra, WAYEGER | 0.000 | 0.000 | 0.000 | 0.000 | 0.058 | 0.000 | 0.917 | 0.025 | ||
| 2 spectra, VSLNLPNVGIK | 0.000 | 0.000 | 0.000 | 0.000 | 0.000 | 0.000 | 0.672 | 0.328 | ||
| 3 spectra, VAGLPR | 0.000 | 0.000 | 0.000 | 0.000 | 0.073 | 0.027 | 0.831 | 0.069 |
| Plot | Mito | Lyso or Perox | ER | Golgi | PM | Cytosol | Nucleus | ||||||
| Expt B |
3 peptides |
3 spectra |
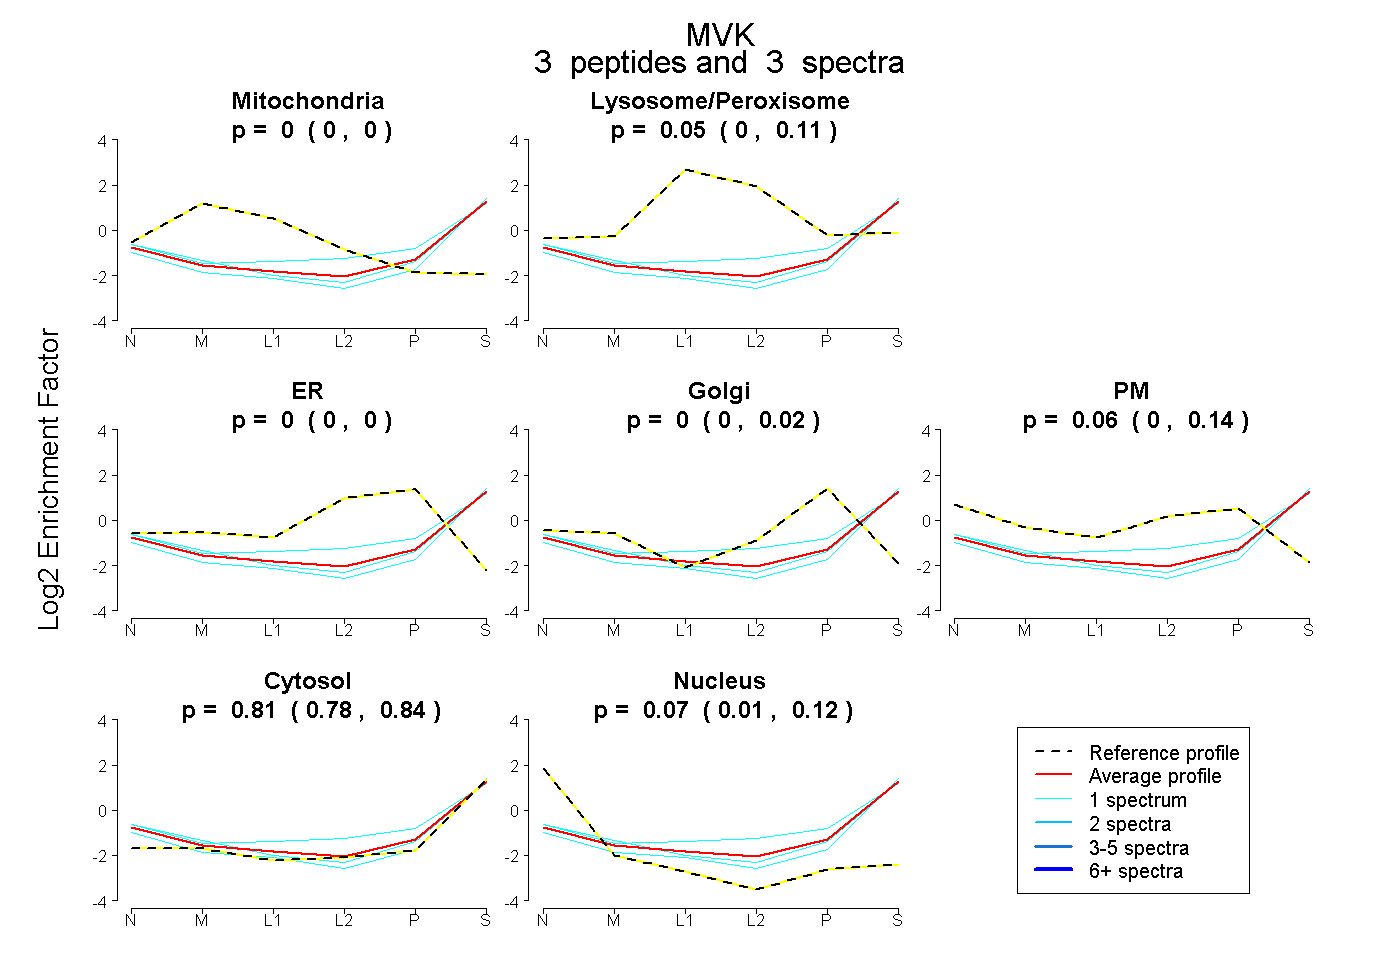 |
0.000 0.000 | 0.000 |
0.052 0.000 | 0.106 |
0.000 0.000 | 0.000 |
0.000 0.000 | 0.020 |
0.060 0.000 | 0.144 |
0.813 0.776 | 0.840 |
0.074 0.010 | 0.123 |
|||
| Plot | Lyso | Other | |||||||||||
| Expt C |
5 peptides |
16 spectra |
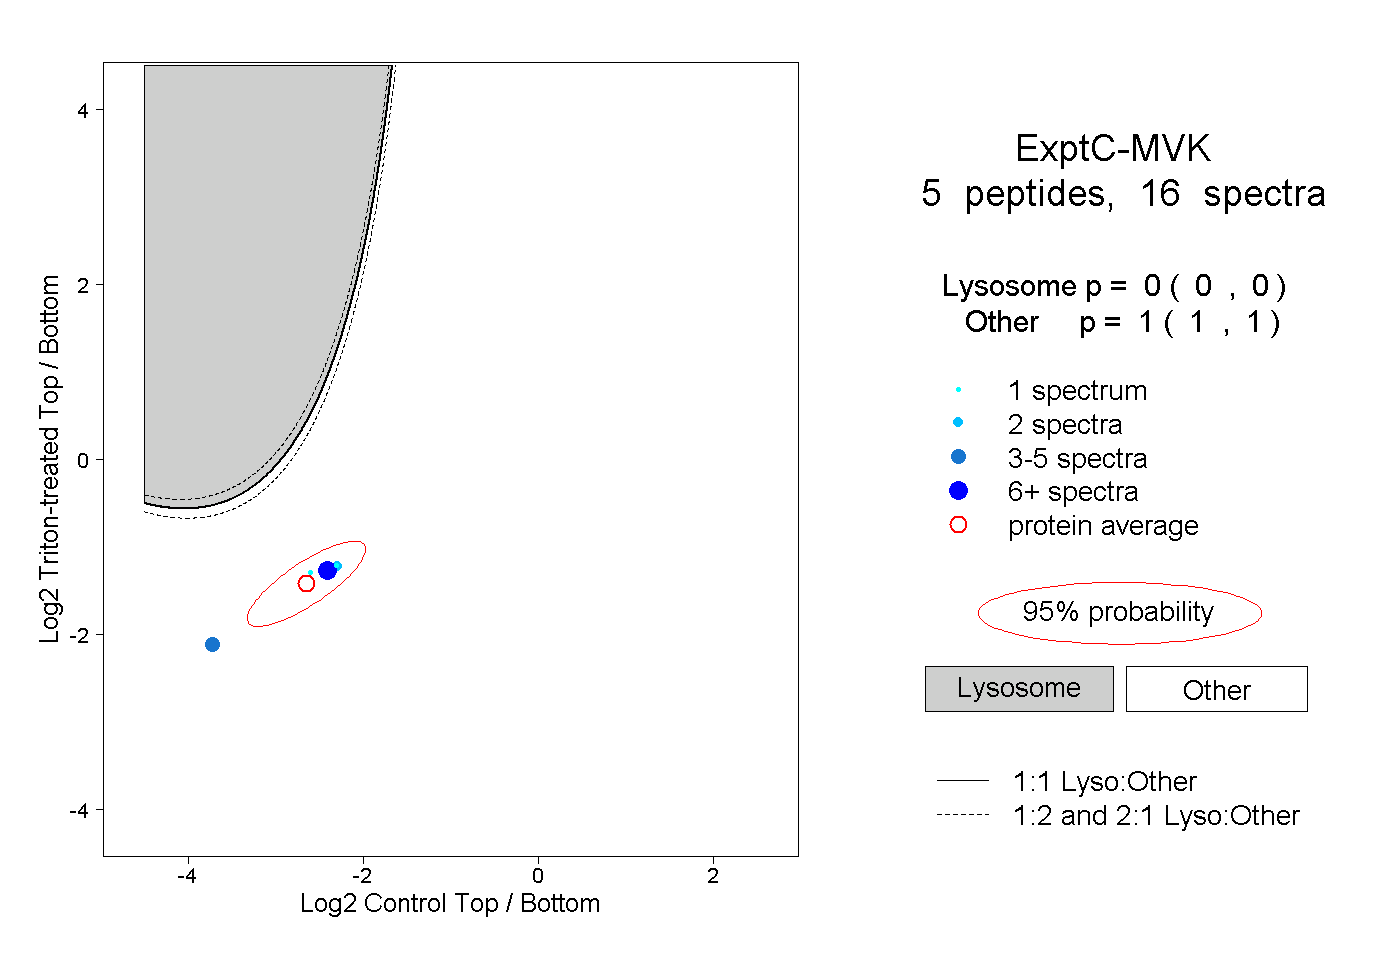 |
0.000 0.000 | 0.000 |
1.000 1.000 | 1.000 |
||||||||
| Plot | Lyso | Other | |||||||||||
| Expt D |
1 peptide |
3 spectra |
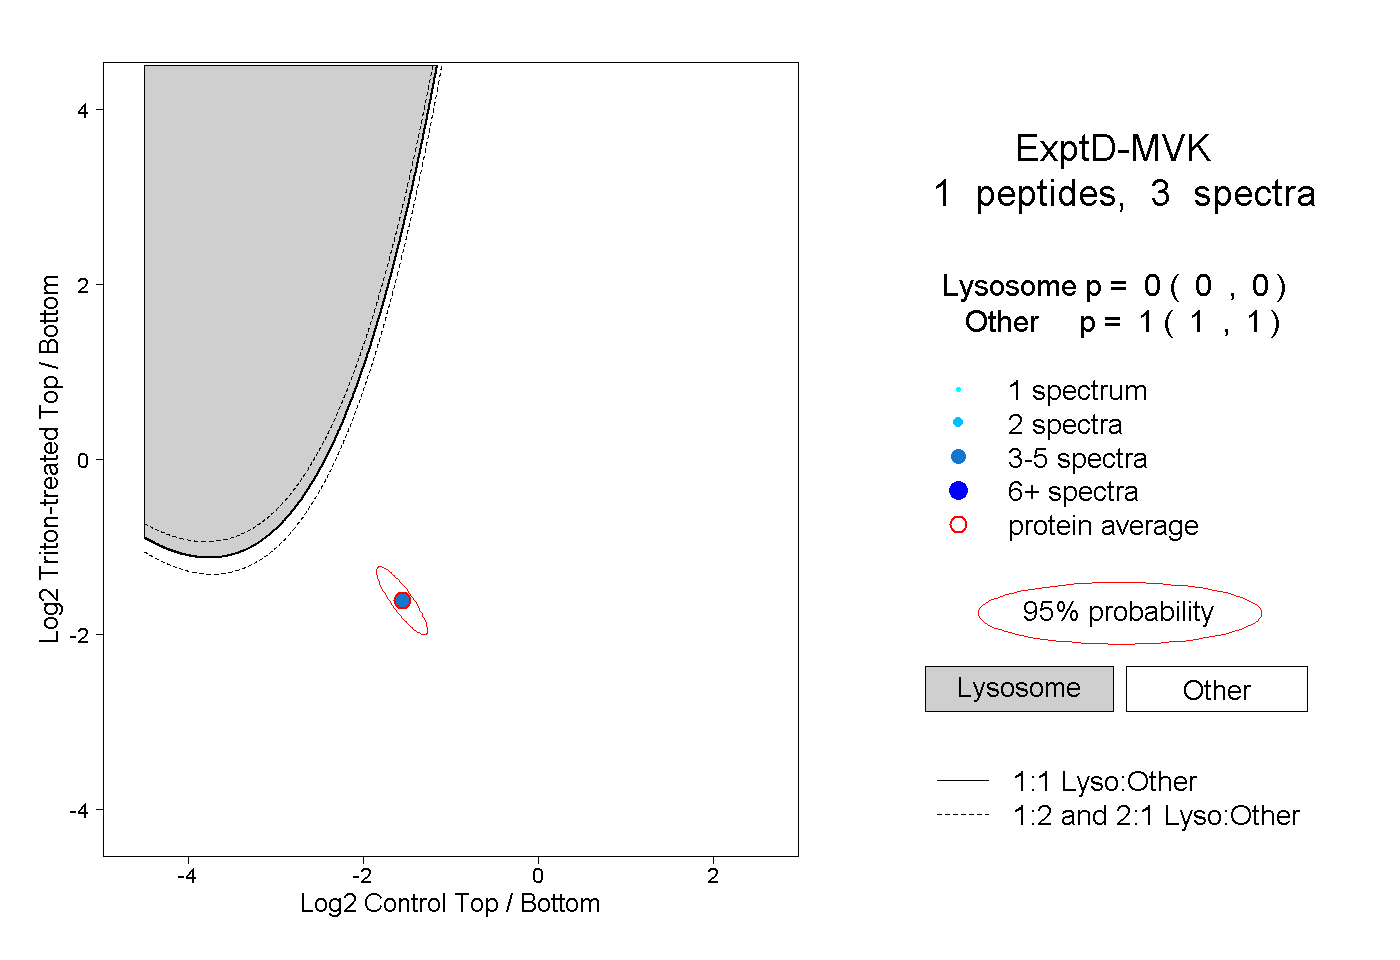 |
0.000 0.000 | 0.000 |
1.000 1.000 | 1.000 |