 4
4peptides
spectra
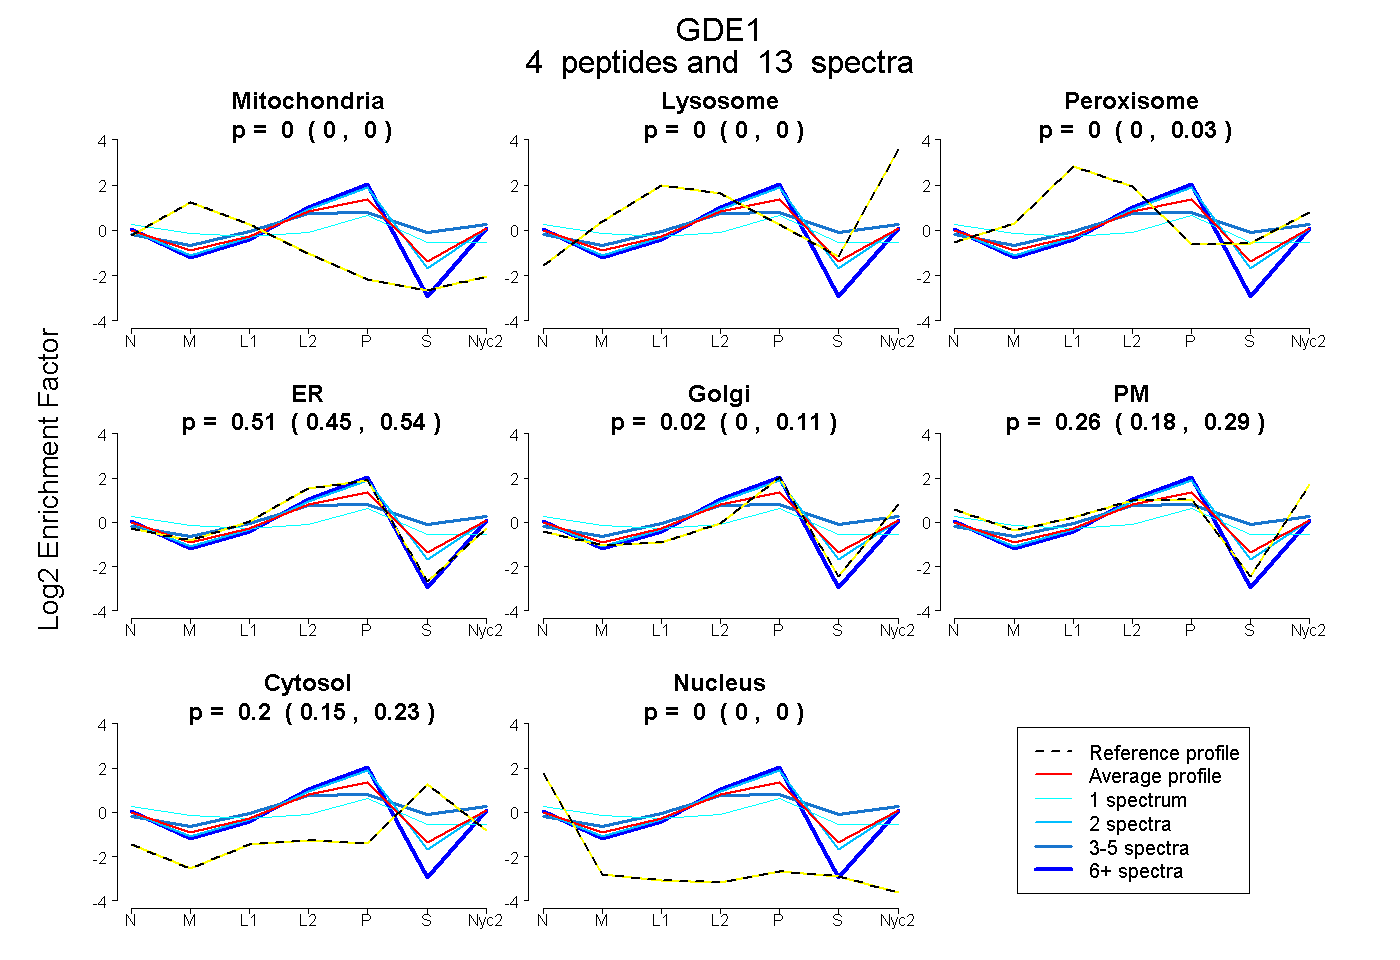
0.000 | 0.000
0.000 | 0.000
0.000 | 0.033
0.455 | 0.541
0.000 | 0.108
0.178 | 0.291
0.152 | 0.232
0.000 | 0.002
1peptide
spectra
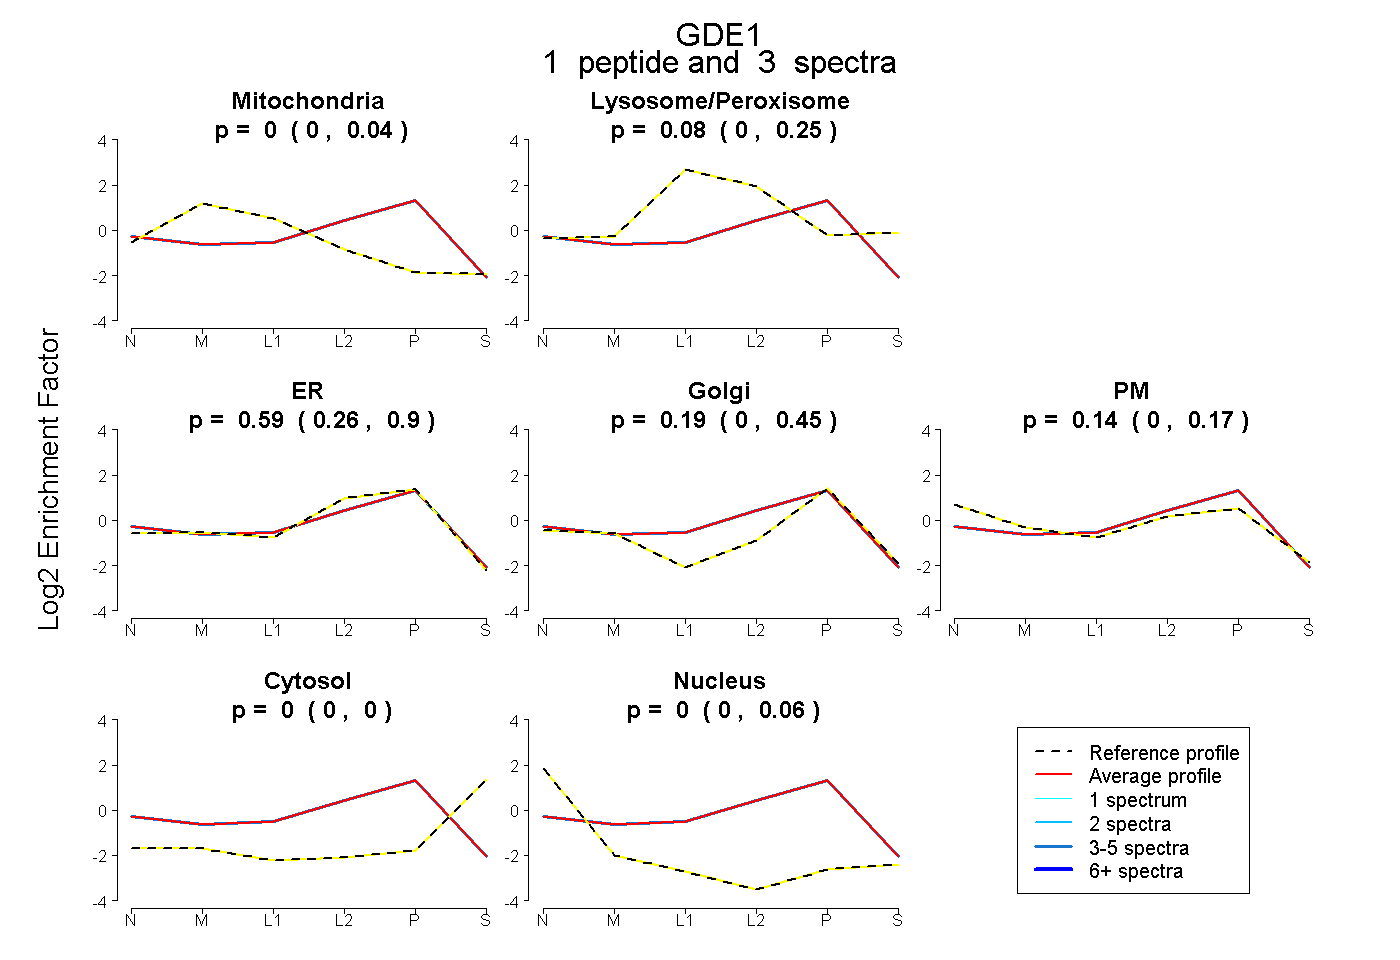
0.000 | 0.036
0.000 | 0.246
0.260 | 0.895
0.000 | 0.450
0.000 | 0.174
0.000 | 0.000
0.000 | 0.063
5peptides
spectra
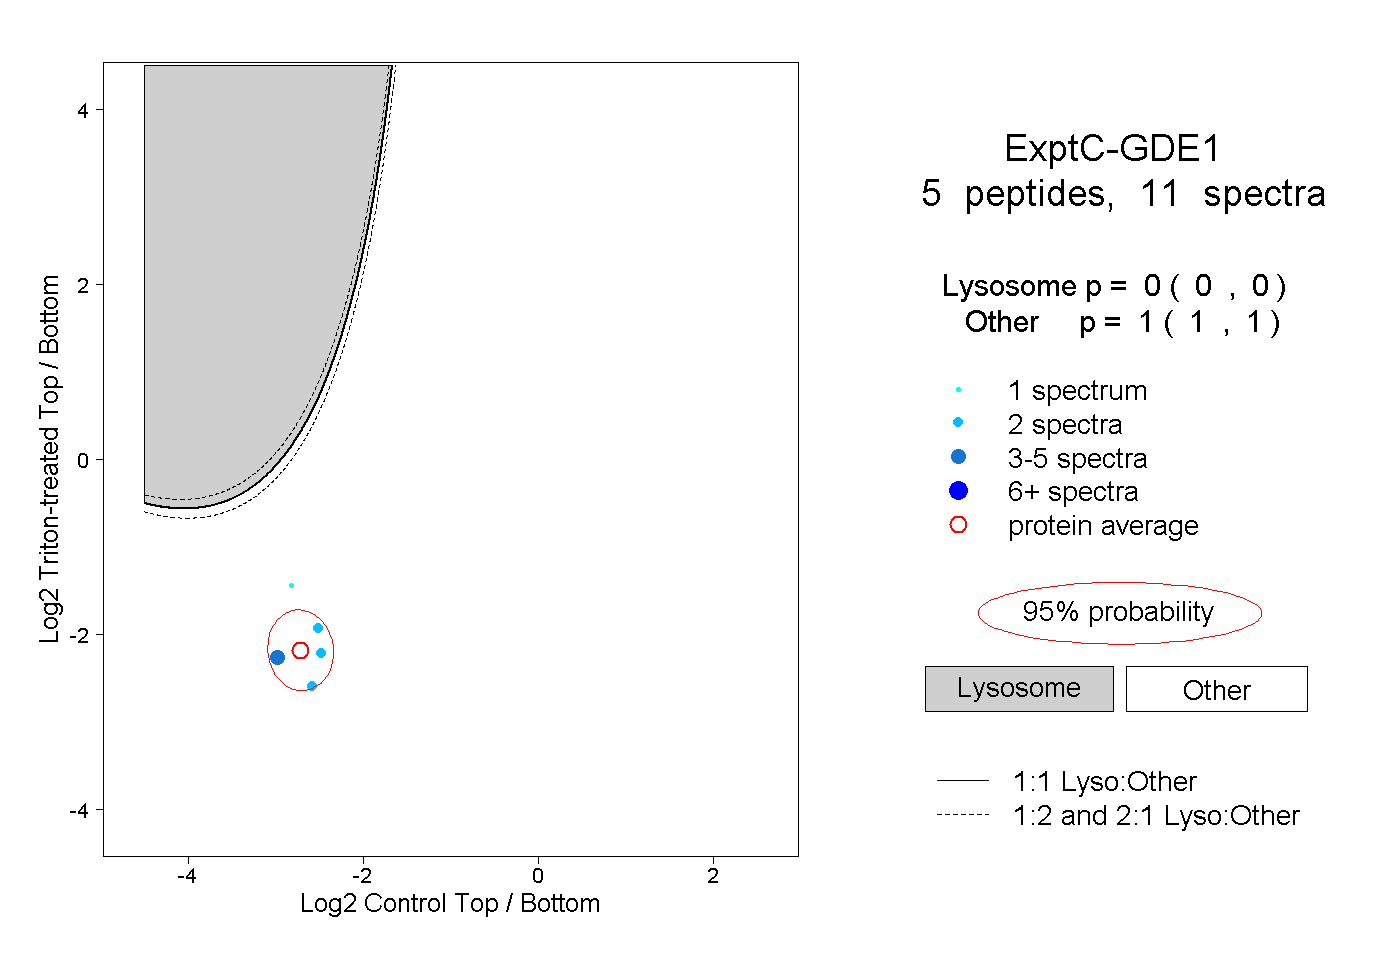
0.000 | 0.000
1.000 | 1.000