 4
4peptides
spectra
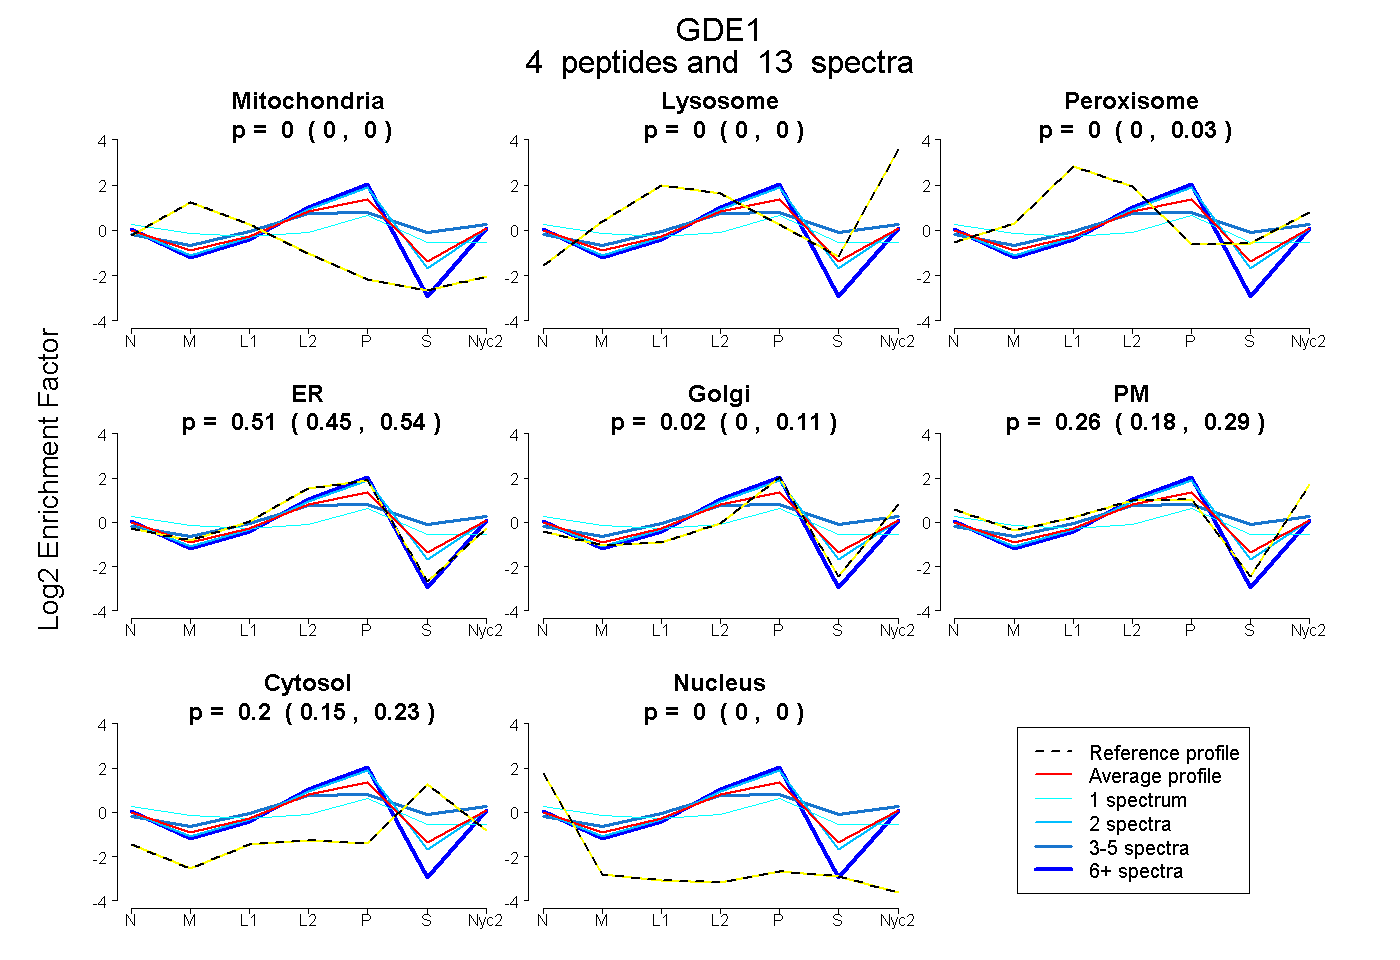
0.000 | 0.000
0.000 | 0.000
0.000 | 0.033
0.455 | 0.541
0.000 | 0.108
0.178 | 0.291
0.152 | 0.232
0.000 | 0.002
| Plot | Mito | Lyso | Perox | ER | Golgi | PM | Cytosol | Nucleus | |||||
| Expt A |
4 peptides |
13 spectra |
|
0.000 0.000 | 0.000 |
0.000 0.000 | 0.000 |
0.000 0.000 | 0.033 |
0.513 0.455 | 0.541 |
0.023 0.000 | 0.108 |
0.262 0.178 | 0.291 |
0.203 0.152 | 0.232 |
0.000 0.000 | 0.002 |
| 2 spectra, LNPAANHR | 0.000 | 0.000 | 0.000 | 0.584 | 0.225 | 0.078 | 0.113 | 0.000 | ||
| 1 spectrum, LCDLTFEQVR | 0.166 | 0.000 | 0.093 | 0.188 | 0.169 | 0.119 | 0.266 | 0.000 | ||
| 4 spectra, GGSHDAPENTLAAIR | 0.000 | 0.000 | 0.240 | 0.188 | 0.121 | 0.157 | 0.294 | 0.000 | ||
| 6 spectra, ALQVLKPR | 0.000 | 0.000 | 0.000 | 0.643 | 0.314 | 0.018 | 0.000 | 0.024 |
| Plot | Mito | Lyso or Perox | ER | Golgi | PM | Cytosol | Nucleus | ||||||
| Expt B |
1 peptide |
3 spectra |
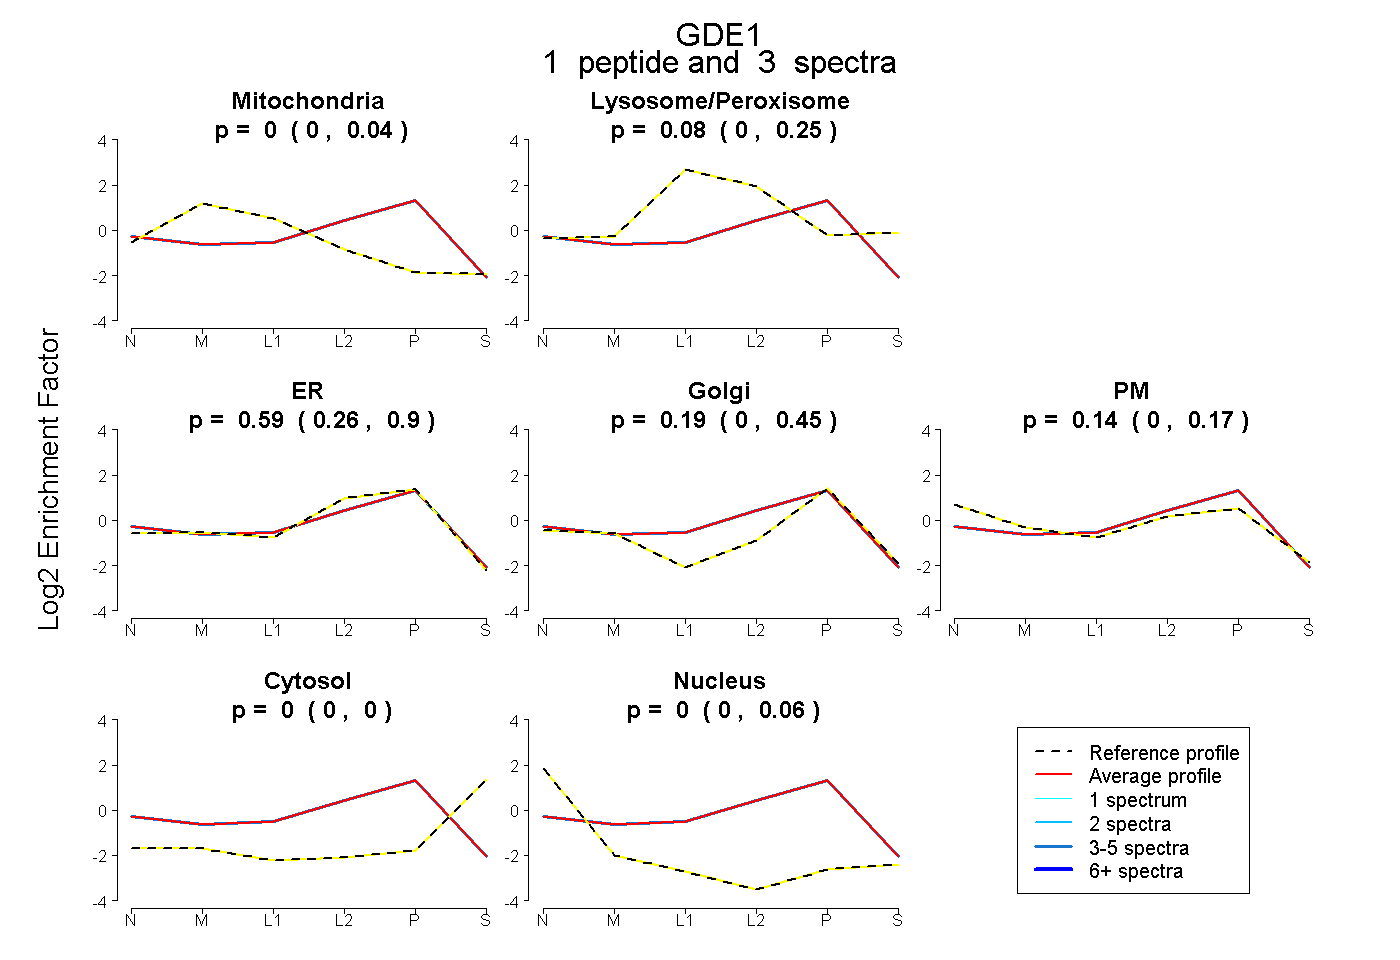 |
0.000 0.000 | 0.036 |
0.081 0.000 | 0.246 |
0.587 0.260 | 0.895 |
0.192 0.000 | 0.450 |
0.141 0.000 | 0.174 |
0.000 0.000 | 0.000 |
0.000 0.000 | 0.063 |
|||
| Plot | Lyso | Other | |||||||||||
| Expt C |
5 peptides |
11 spectra |
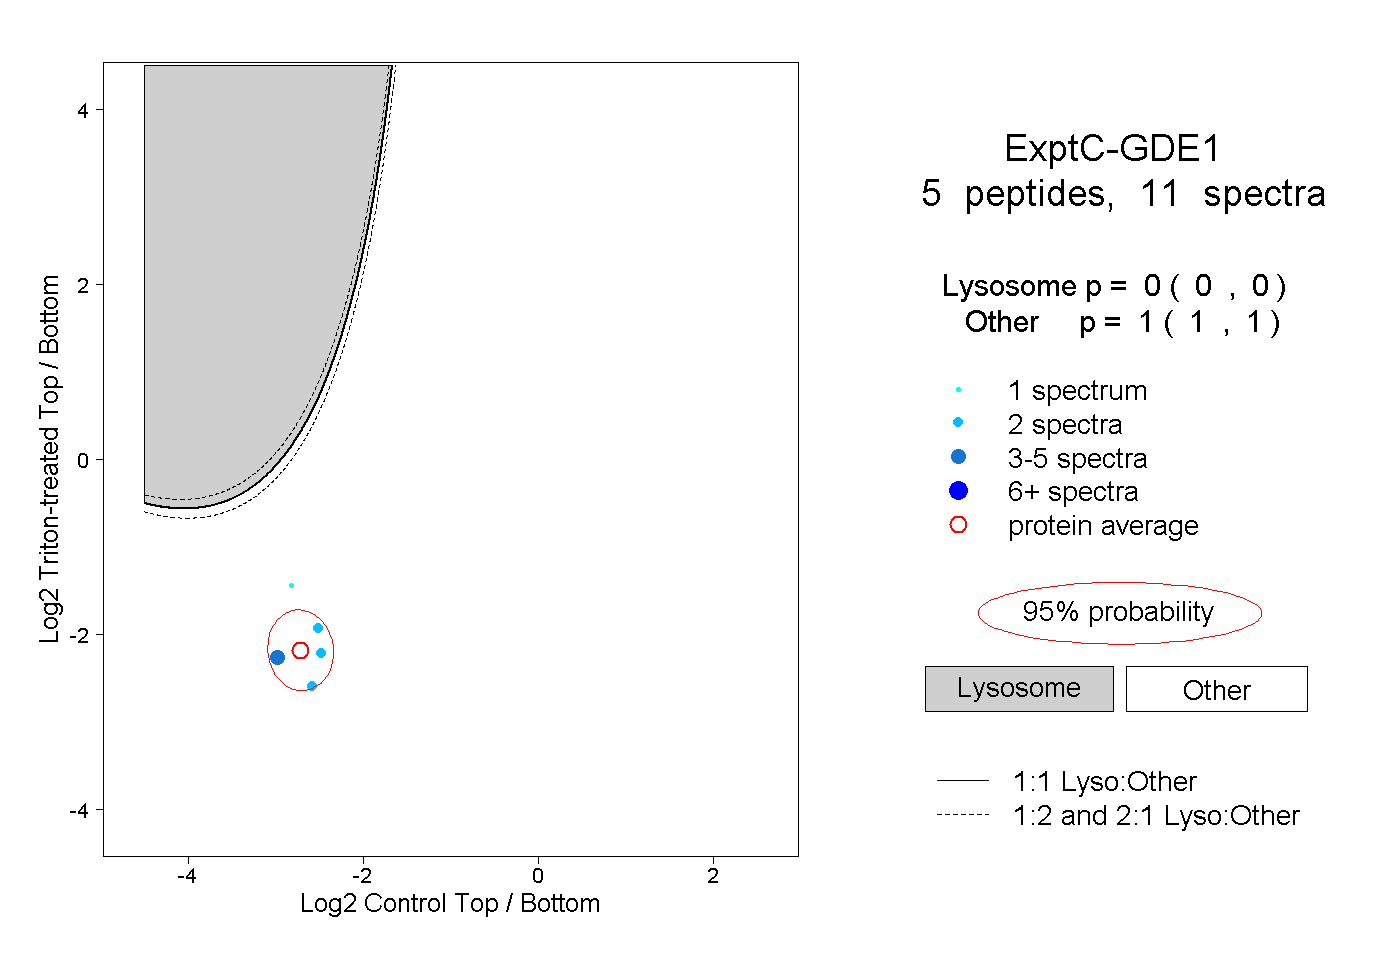 |
0.000 0.000 | 0.000 |
1.000 1.000 | 1.000 |