 7
7peptides
spectra
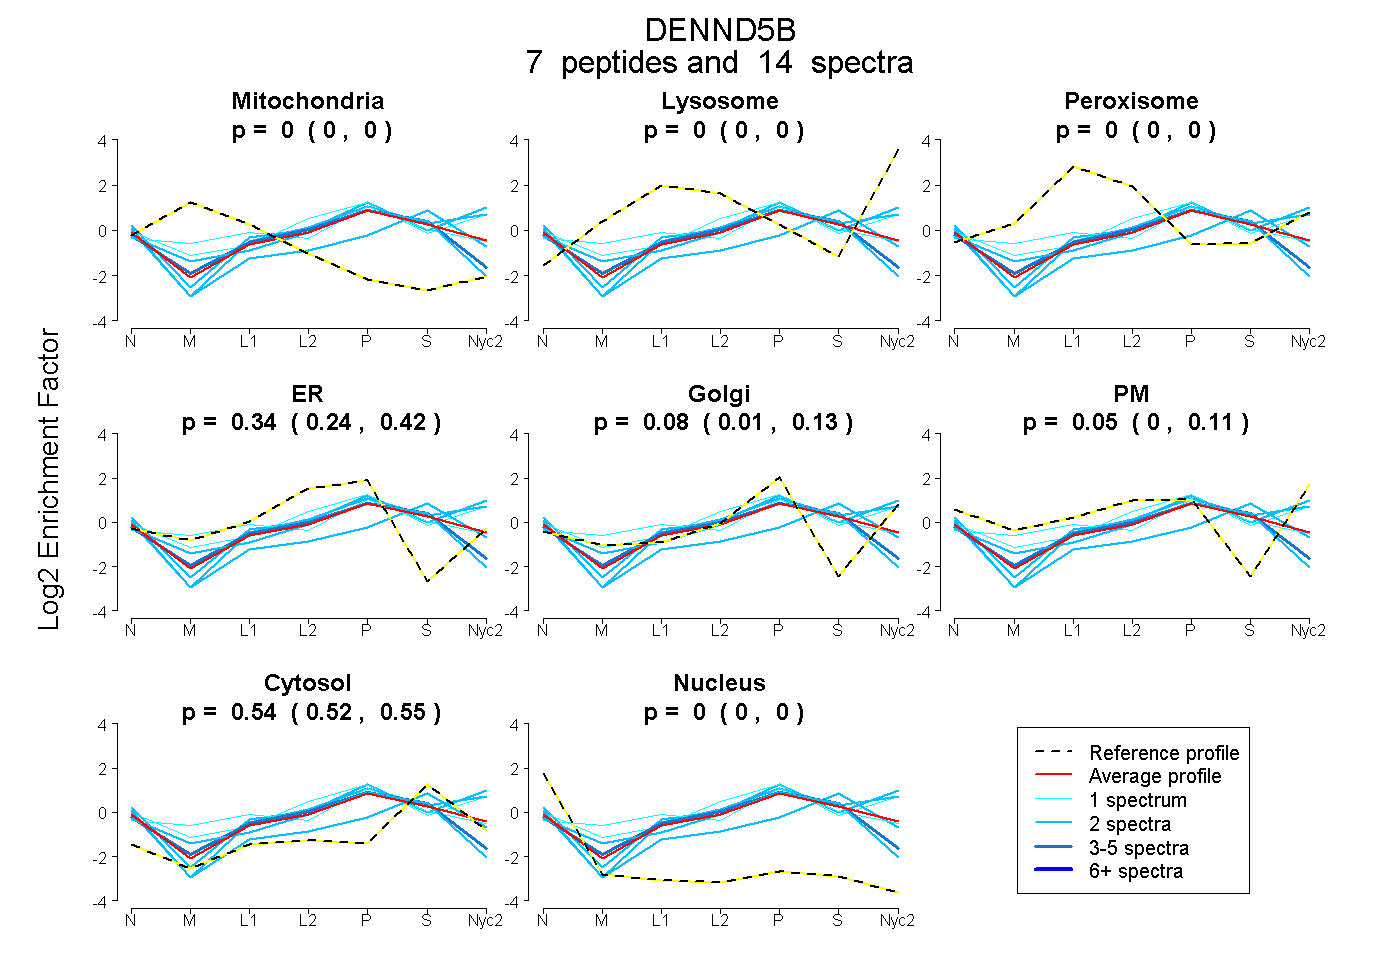
0.000 | 0.000
0.000 | 0.000
0.000 | 0.000
0.244 | 0.417
0.009 | 0.126
0.000 | 0.111
0.516 | 0.552
0.000 | 0.000
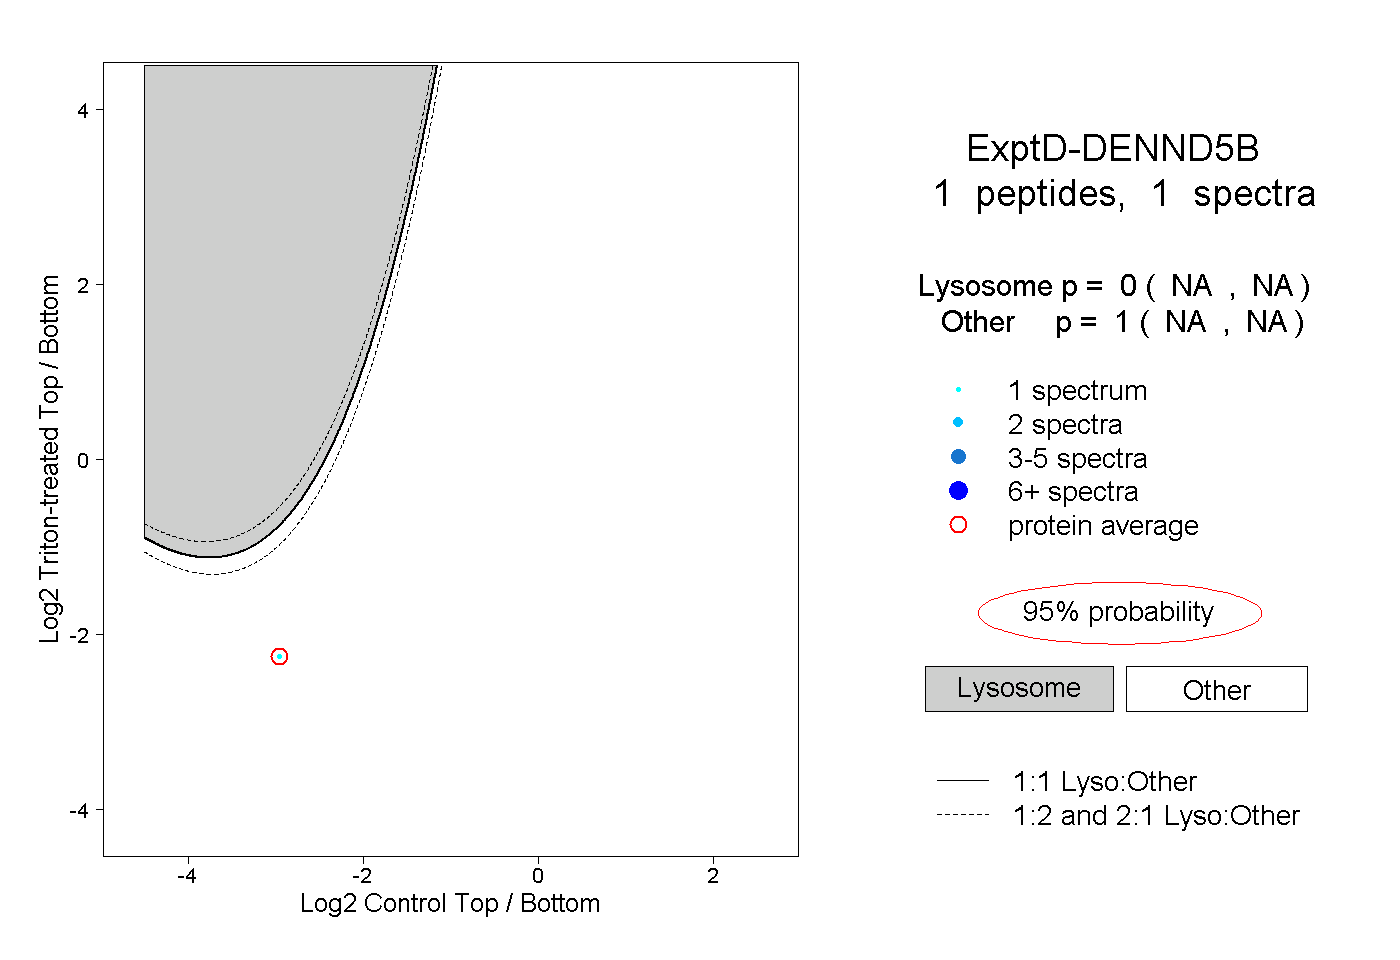
1peptide
spectra

NA | NA
NA | NA
NA | NA
NA | NA
NA | NA
NA | NA
NA | NA
6peptides
spectra
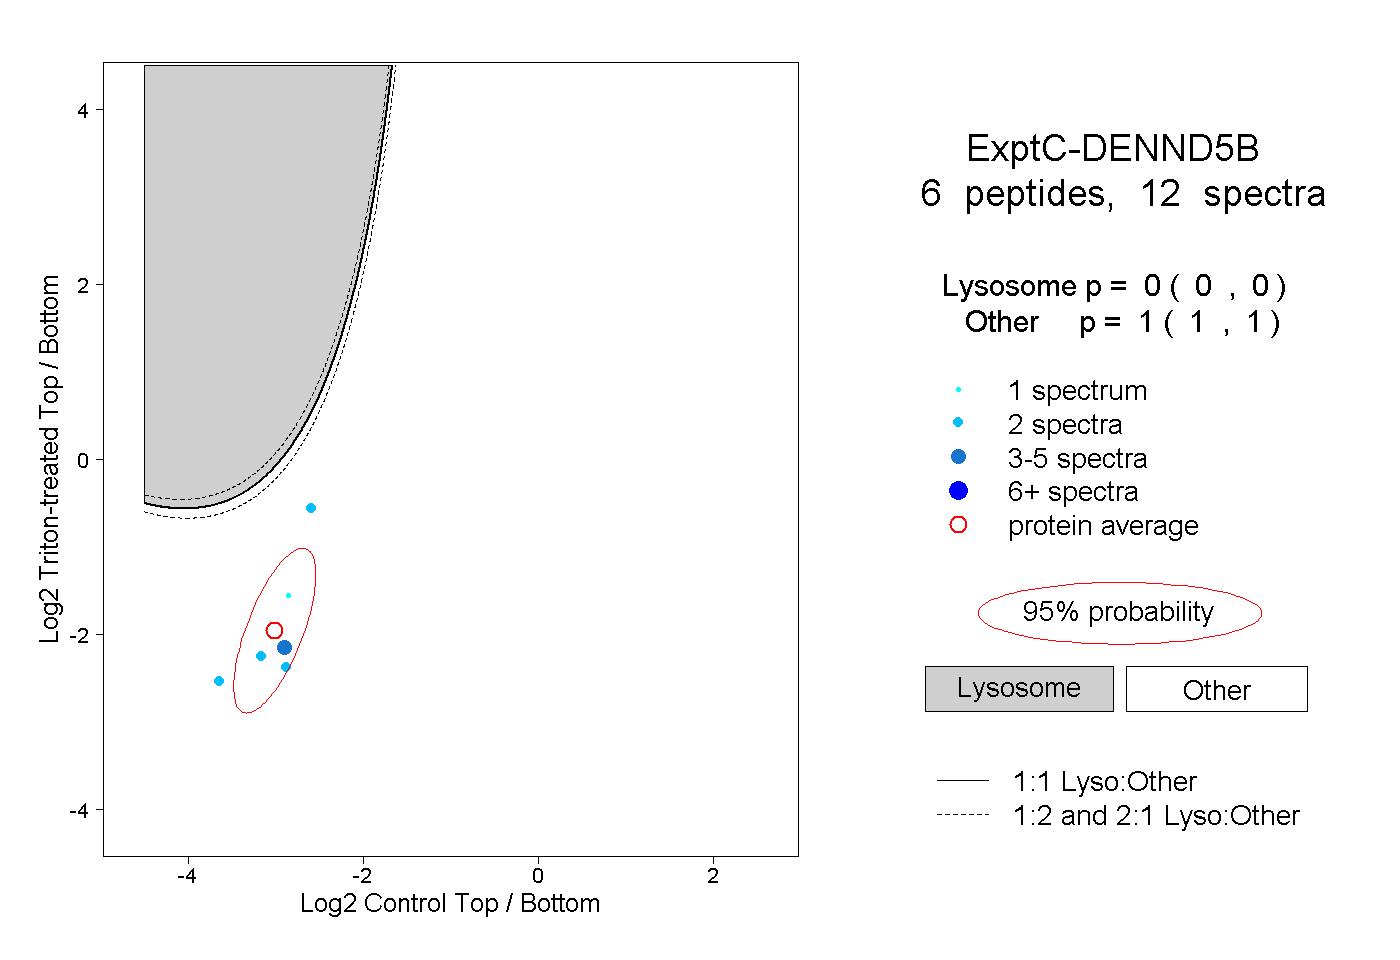
0.000 | 0.000
1.000 | 1.000
1peptide
spectrum
NA | NA
NA | NA