 6
6peptides
spectra
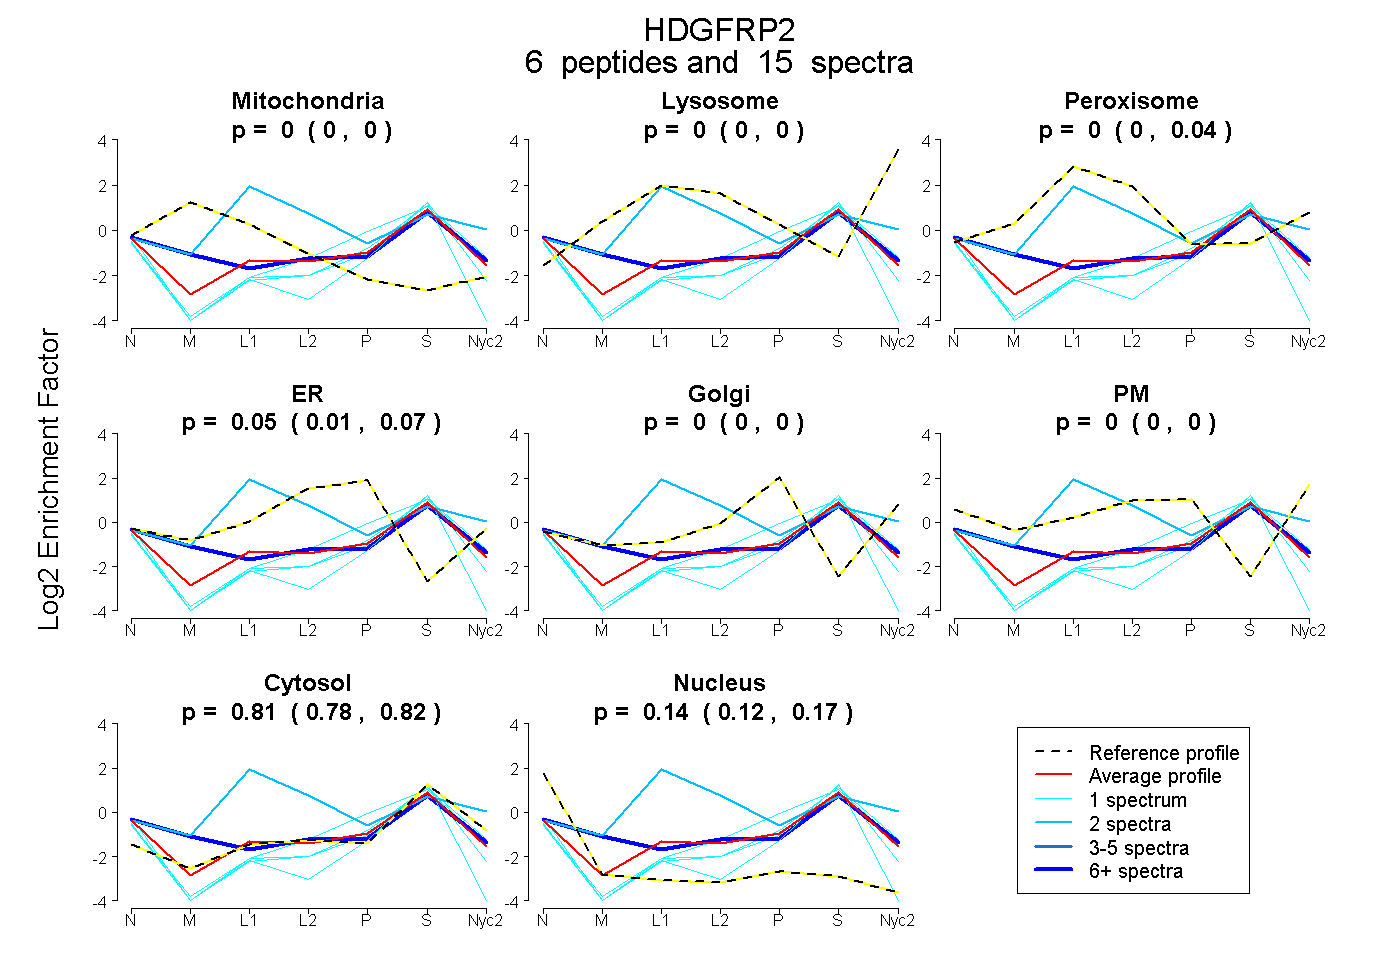
0.000 | 0.000
0.000 | 0.000
0.000 | 0.037
0.006 | 0.067
0.000 | 0.000
0.000 | 0.000
0.775 | 0.823
0.119 | 0.169
4peptides
spectra
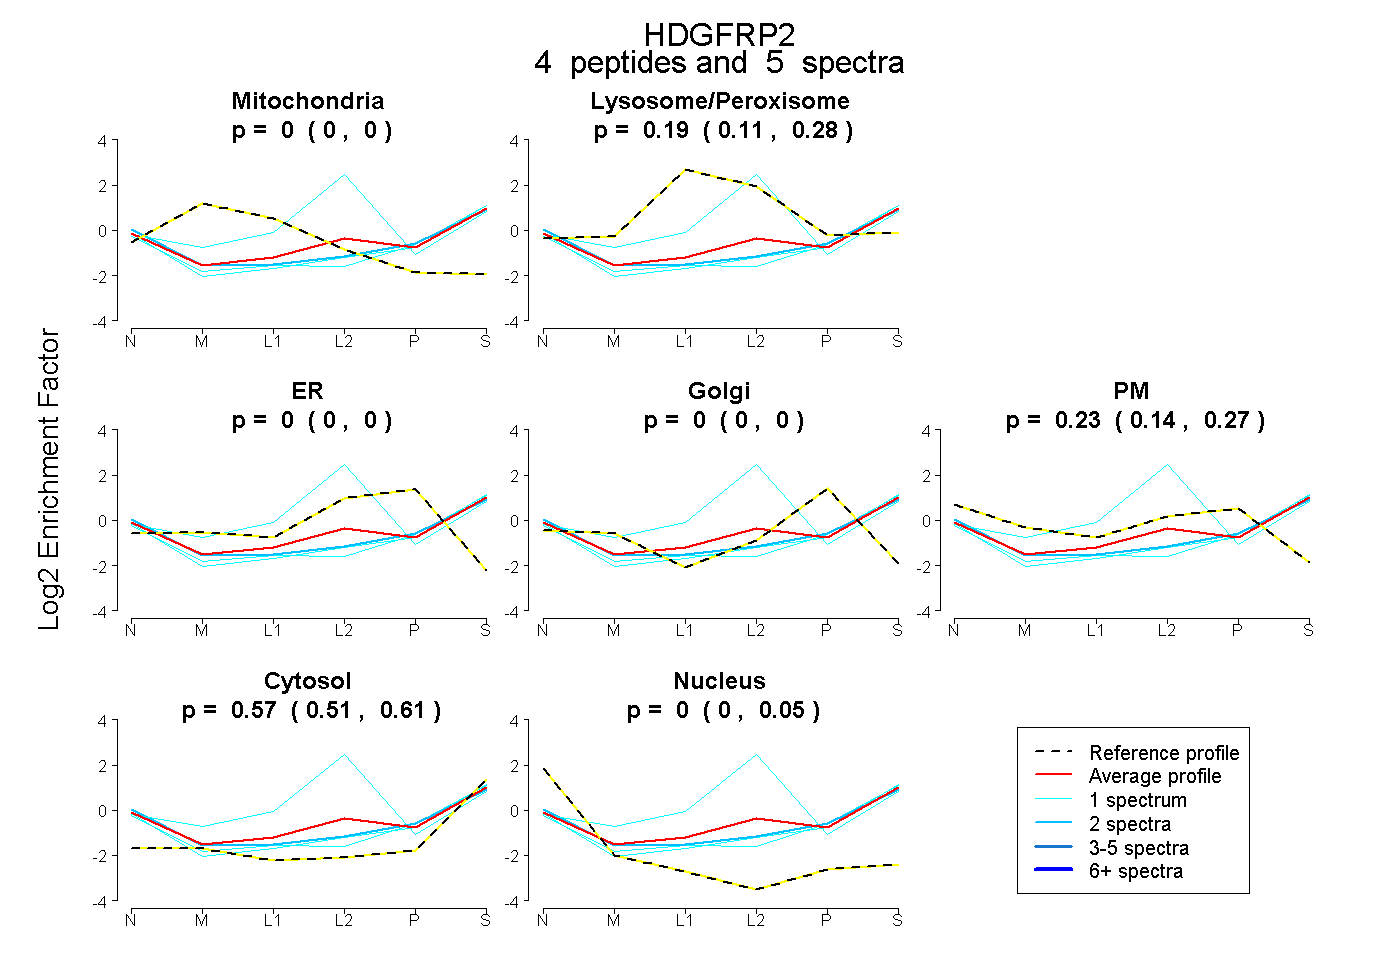
0.000 | 0.000
0.114 | 0.280
0.000 | 0.000
0.000 | 0.000
0.138 | 0.267
0.505 | 0.615
0.000 | 0.055
3peptides
spectra
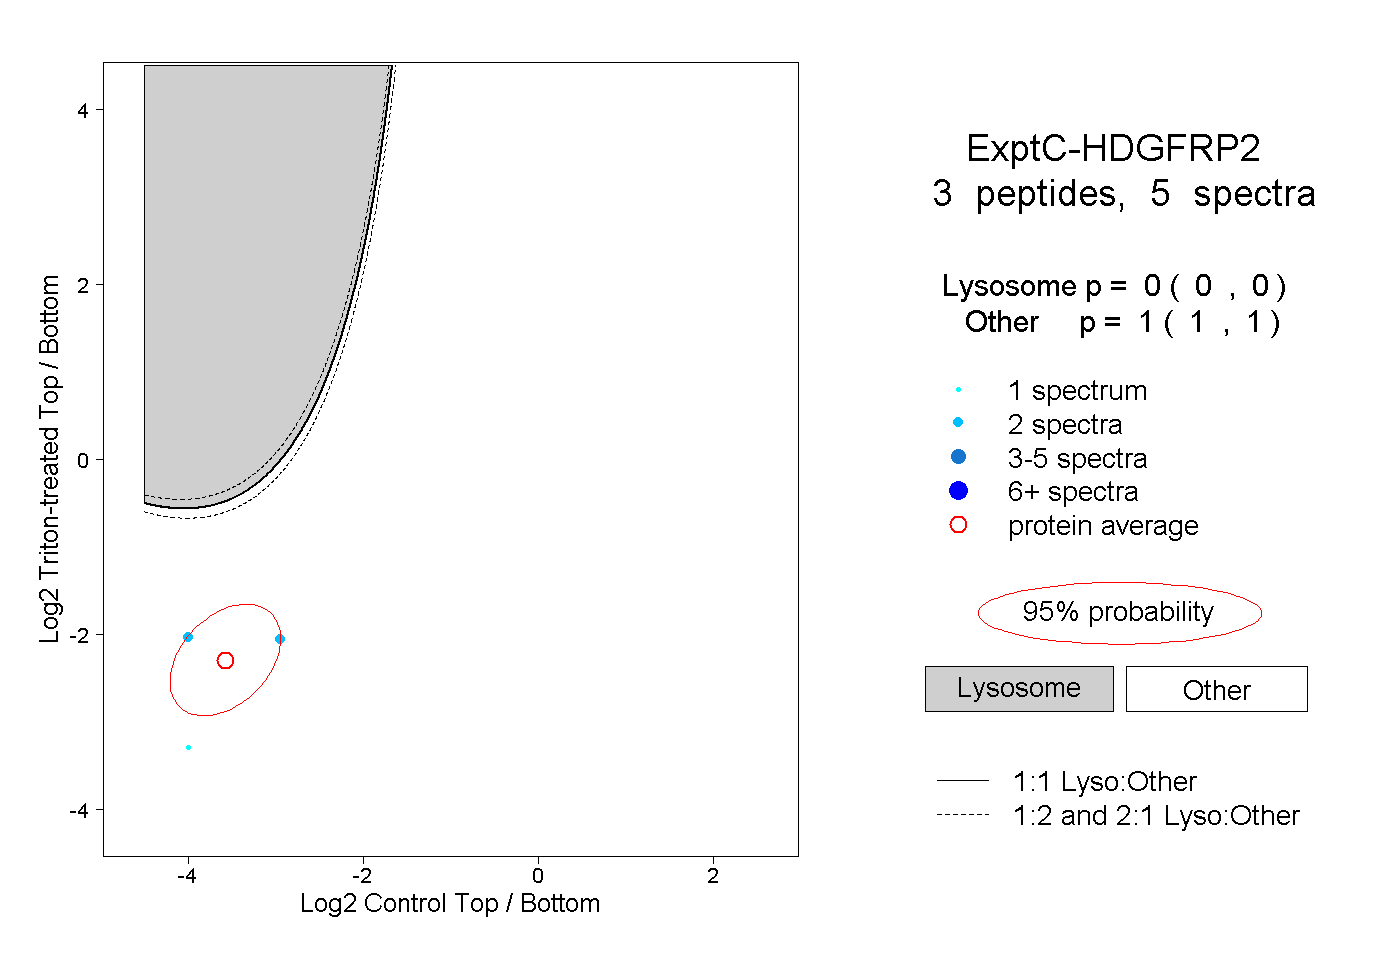
0.000 | 0.000
1.000 | 1.000
2peptides
spectra
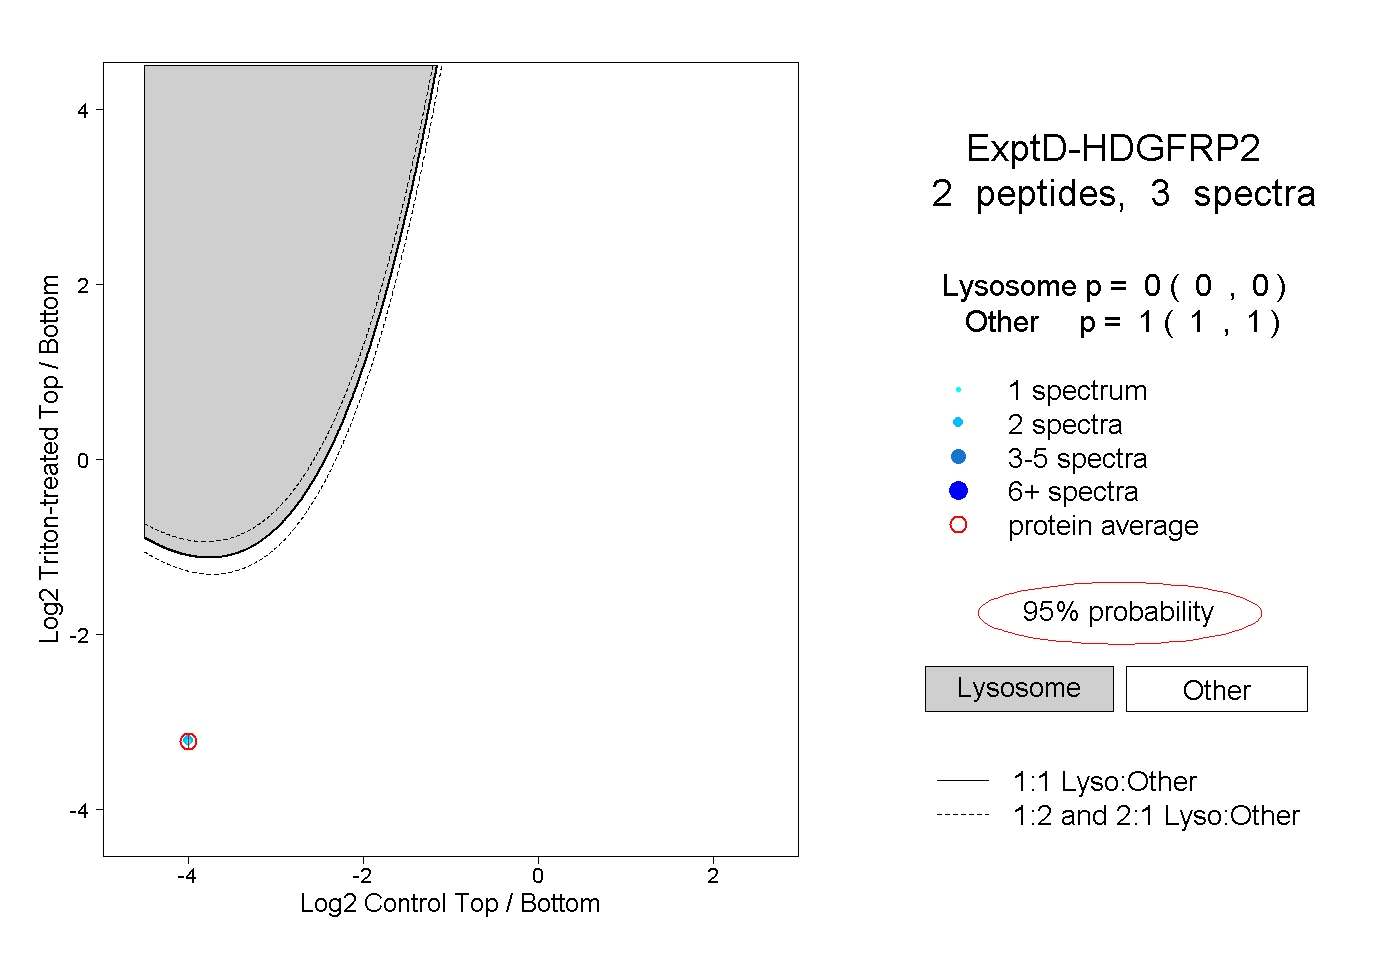
0.000 | 0.000
1.000 | 1.000