 6
6peptides
spectra
0.000 | 0.000
0.000 | 0.000
0.000 | 0.037
0.006 | 0.067
0.000 | 0.000
0.000 | 0.000
0.775 | 0.823
0.119 | 0.169
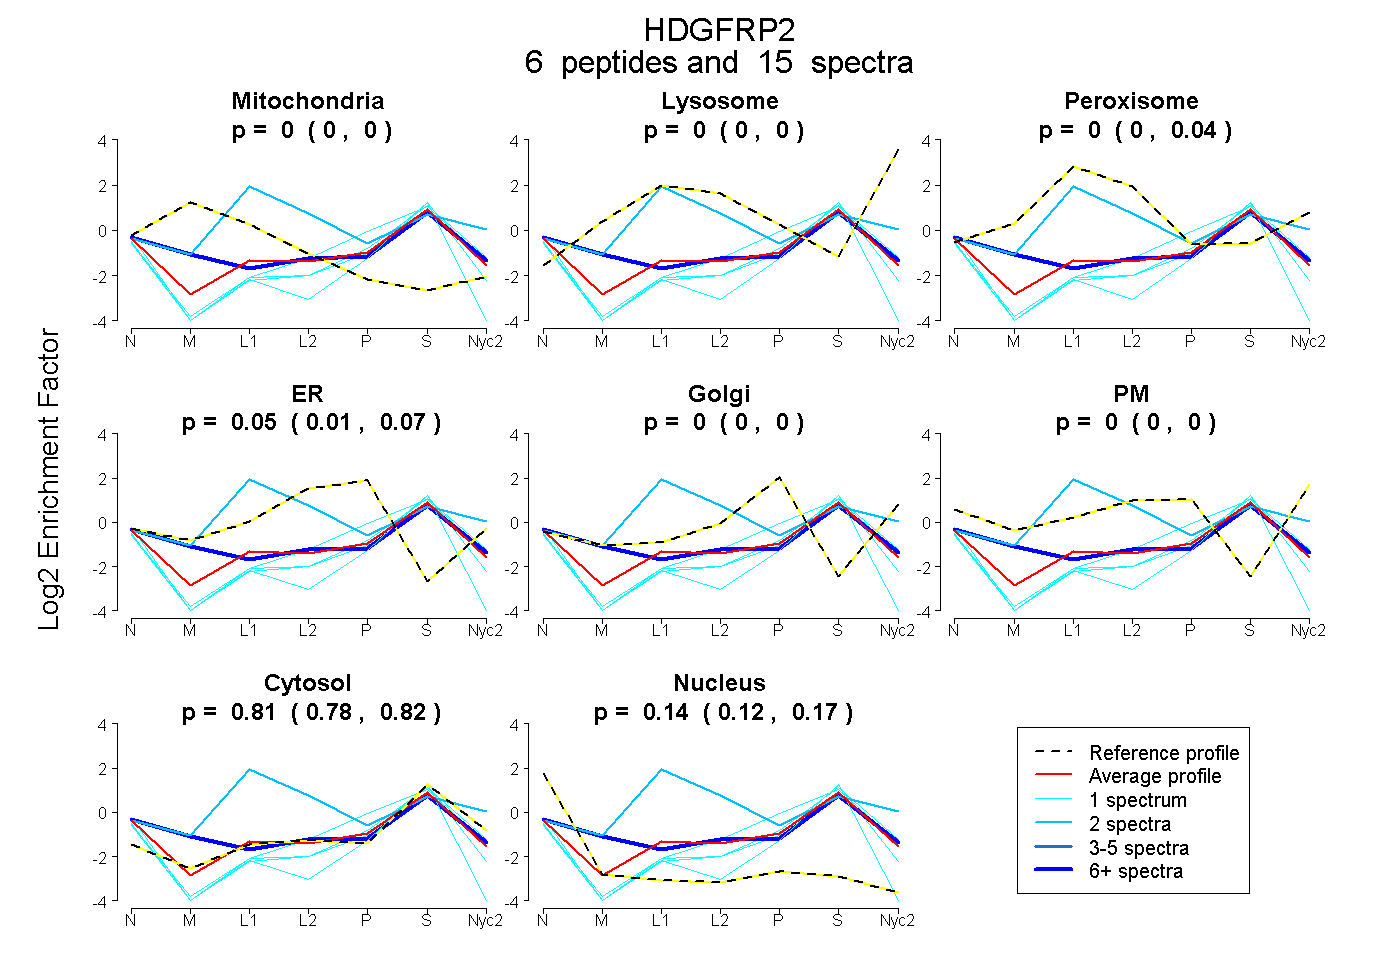
| Plot | Mito | Lyso | Perox | ER | Golgi | PM | Cytosol | Nucleus | |||||
| Expt A |
6 peptides |
15 spectra |
|
0.000 0.000 | 0.000 |
0.000 0.000 | 0.000 |
0.000 0.000 | 0.037 |
0.050 0.006 | 0.067 |
0.000 0.000 | 0.000 |
0.000 0.000 | 0.000 |
0.808 0.775 | 0.823 |
0.142 0.119 | 0.169 |
| 1 spectrum, AAEVYTR | 0.000 | 0.000 | 0.000 | 0.000 | 0.000 | 0.000 | 0.786 | 0.214 | ||
| 1 spectrum, SQLQGSESAR | 0.000 | 0.000 | 0.000 | 0.000 | 0.000 | 0.000 | 0.615 | 0.385 | ||
| 2 spectra, NSDHSGLK | 0.000 | 0.000 | 0.668 | 0.000 | 0.000 | 0.000 | 0.332 | 0.000 | ||
| 1 spectrum, EPSVEER | 0.000 | 0.000 | 0.000 | 0.000 | 0.077 | 0.000 | 0.820 | 0.102 | ||
| 1 spectrum, DLFPYDK | 0.000 | 0.000 | 0.000 | 0.000 | 0.000 | 0.000 | 0.824 | 0.176 | ||
| 9 spectra, GYPHWPAR | 0.186 | 0.000 | 0.000 | 0.000 | 0.009 | 0.027 | 0.715 | 0.064 |
| Plot | Mito | Lyso or Perox | ER | Golgi | PM | Cytosol | Nucleus | ||||||
| Expt B |
4 peptides |
5 spectra |
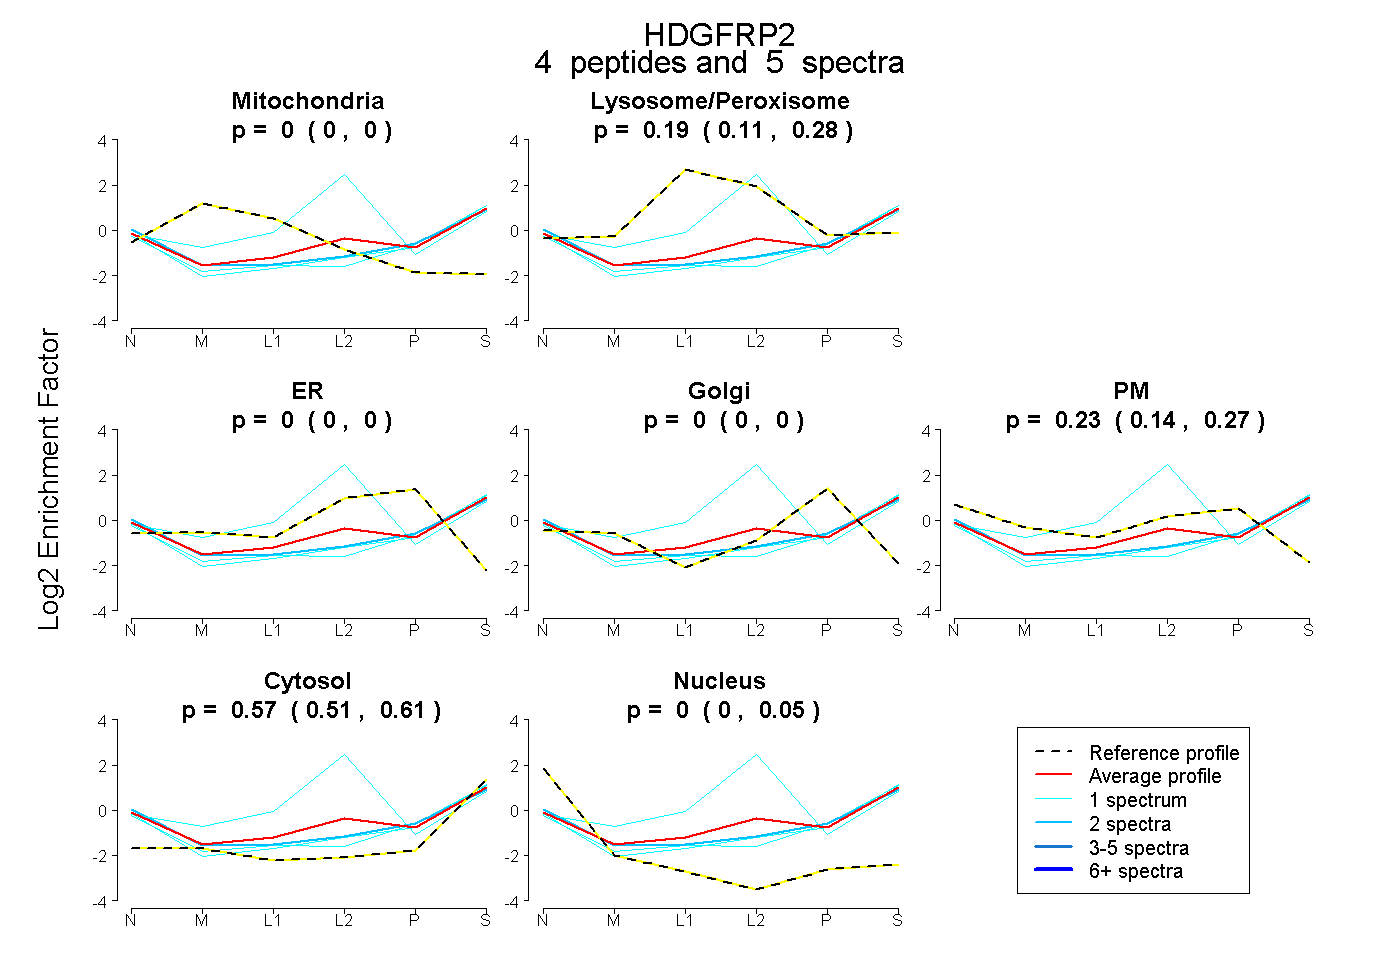 |
0.000 0.000 | 0.000 |
0.194 0.114 | 0.280 |
0.000 0.000 | 0.000 |
0.000 0.000 | 0.000 |
0.233 0.138 | 0.267 |
0.574 0.505 | 0.615 |
0.000 0.000 | 0.055 |
|||
| Plot | Lyso | Other | |||||||||||
| Expt C |
3 peptides |
5 spectra |
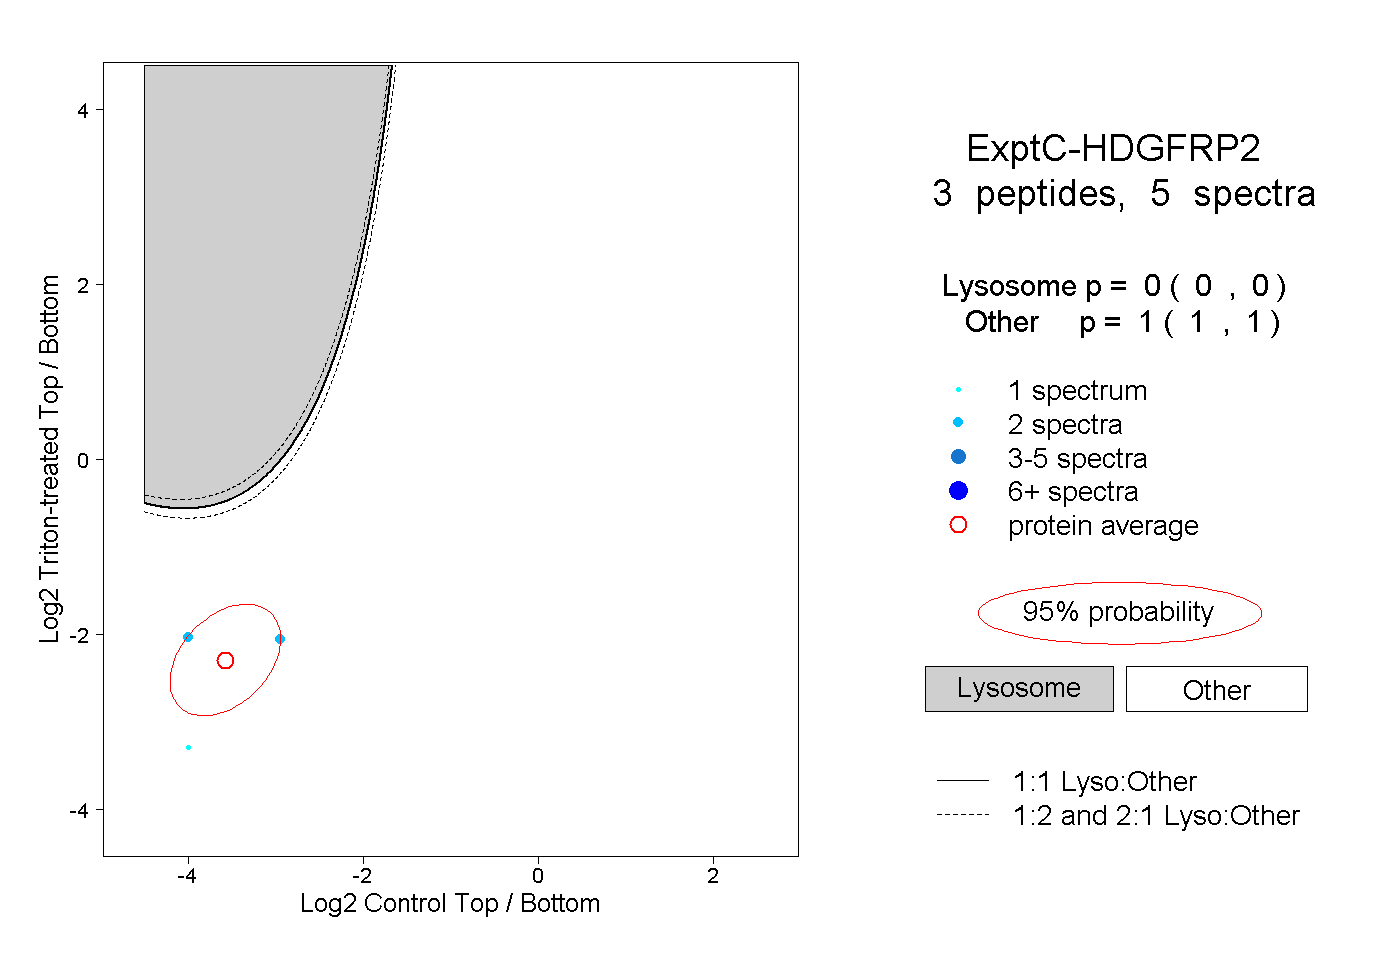 |
0.000 0.000 | 0.000 |
1.000 1.000 | 1.000 |
||||||||
| Plot | Lyso | Other | |||||||||||
| Expt D |
2 peptides |
3 spectra |
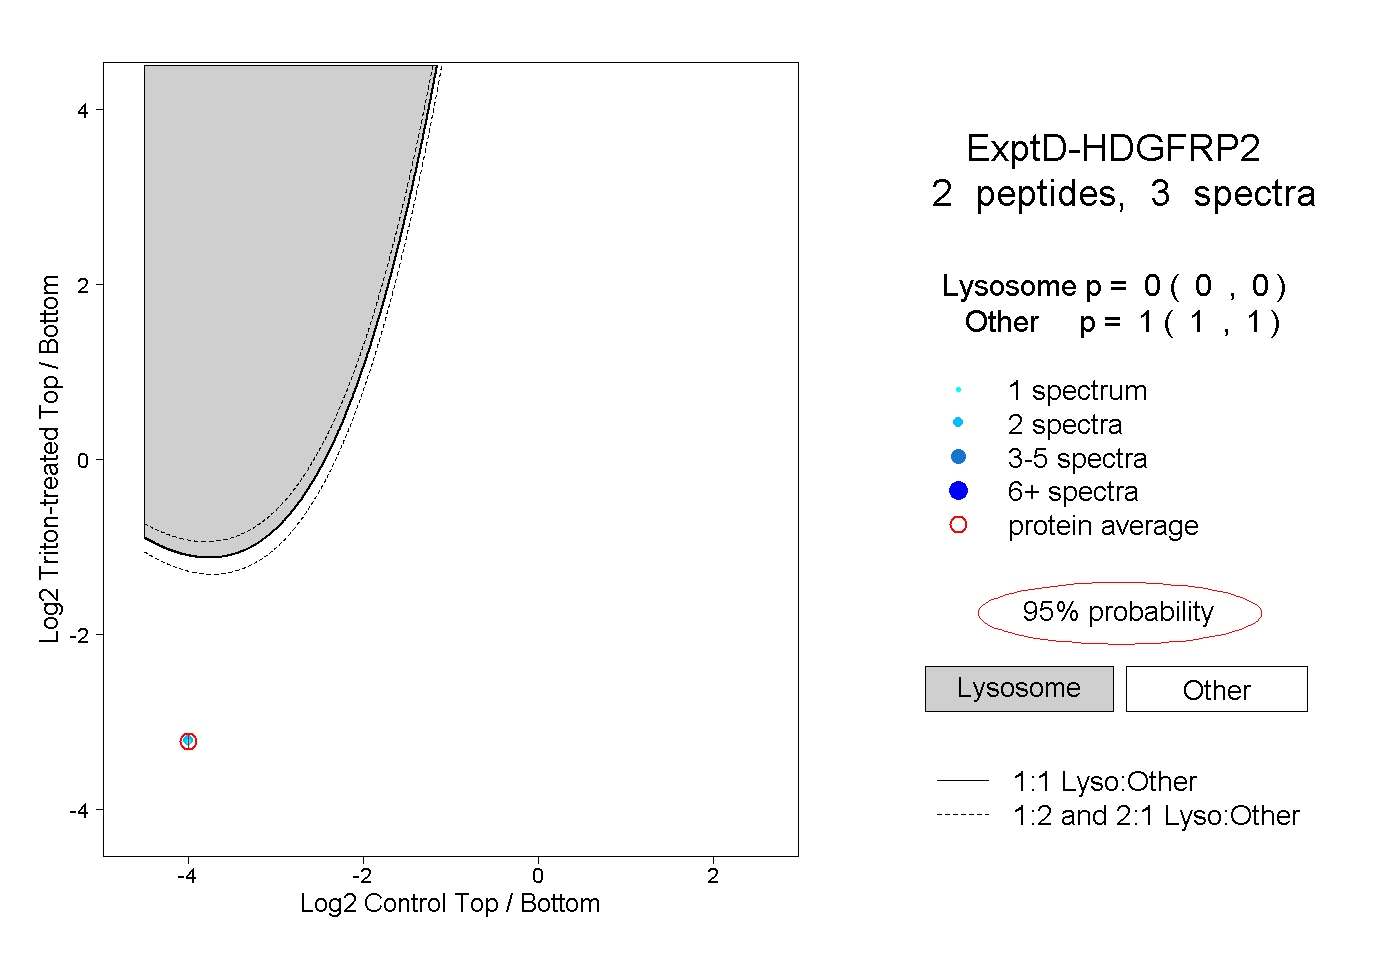 |
0.000 0.000 | 0.000 |
1.000 1.000 | 1.000 |