 4
4peptides
spectra
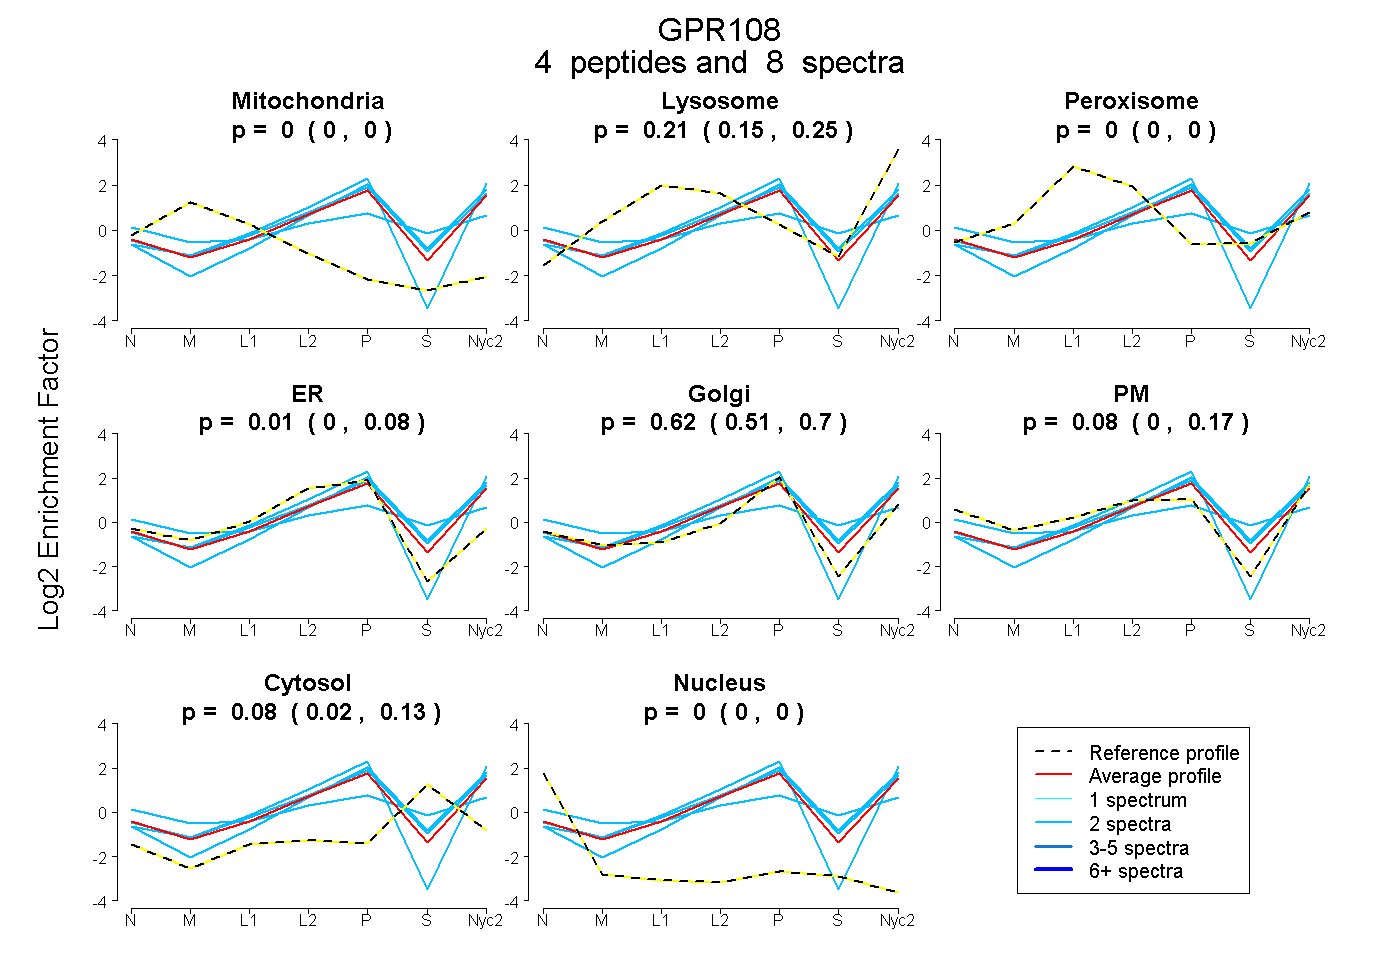
0.000 | 0.000
0.155 | 0.250
0.000 | 0.000
0.000 | 0.083
0.505 | 0.698
0.000 | 0.170
0.021 | 0.131
0.000 | 0.000
2peptides
spectra
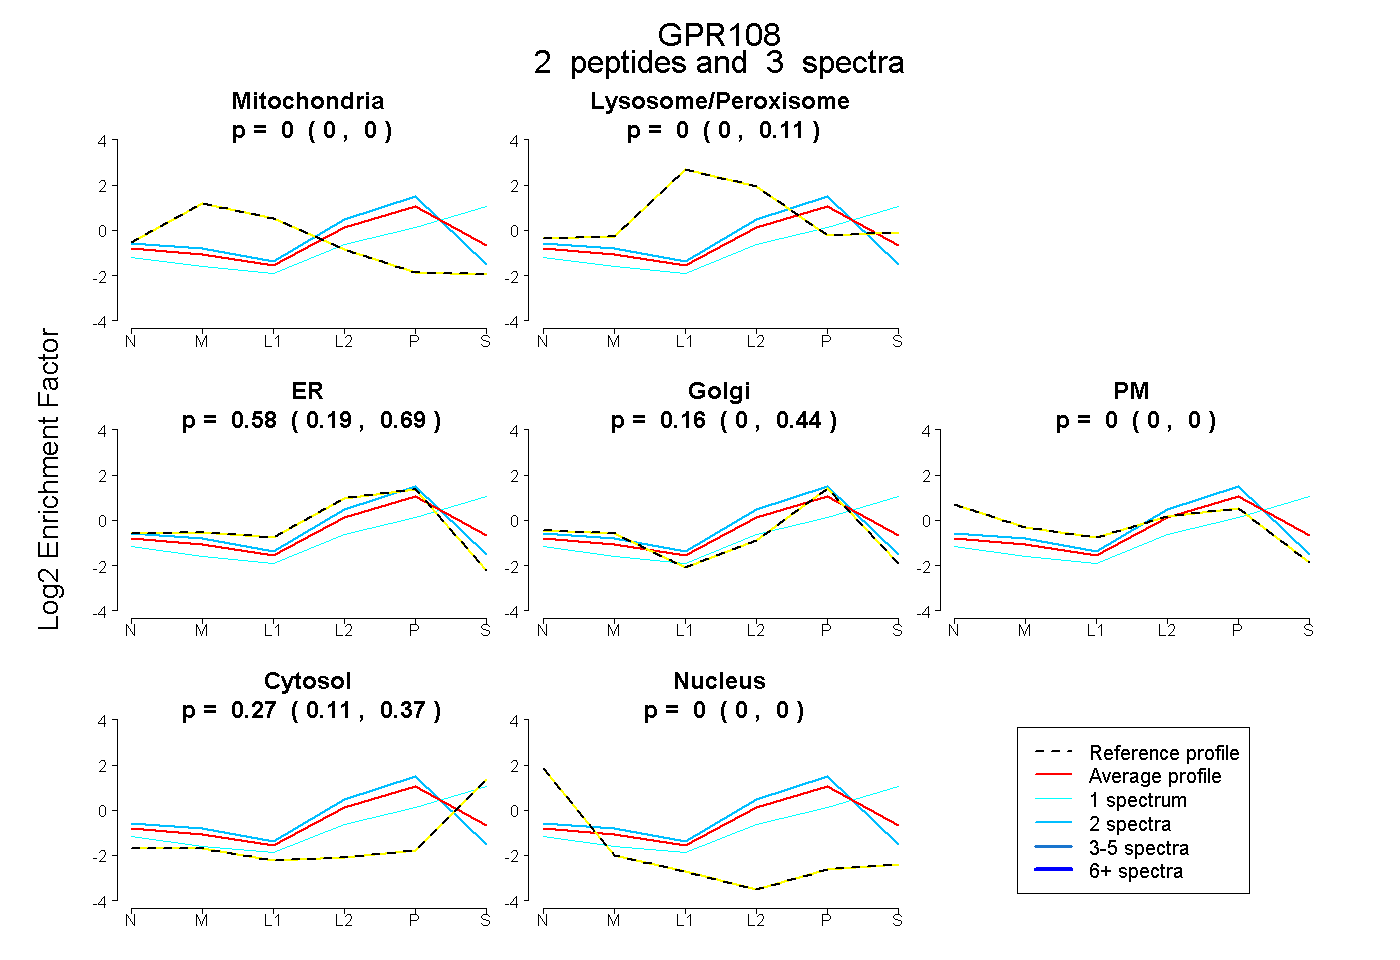
0.000 | 0.000
0.000 | 0.108
0.186 | 0.693
0.000 | 0.444
0.000 | 0.000
0.106 | 0.371
0.000 | 0.000
6peptides
spectra
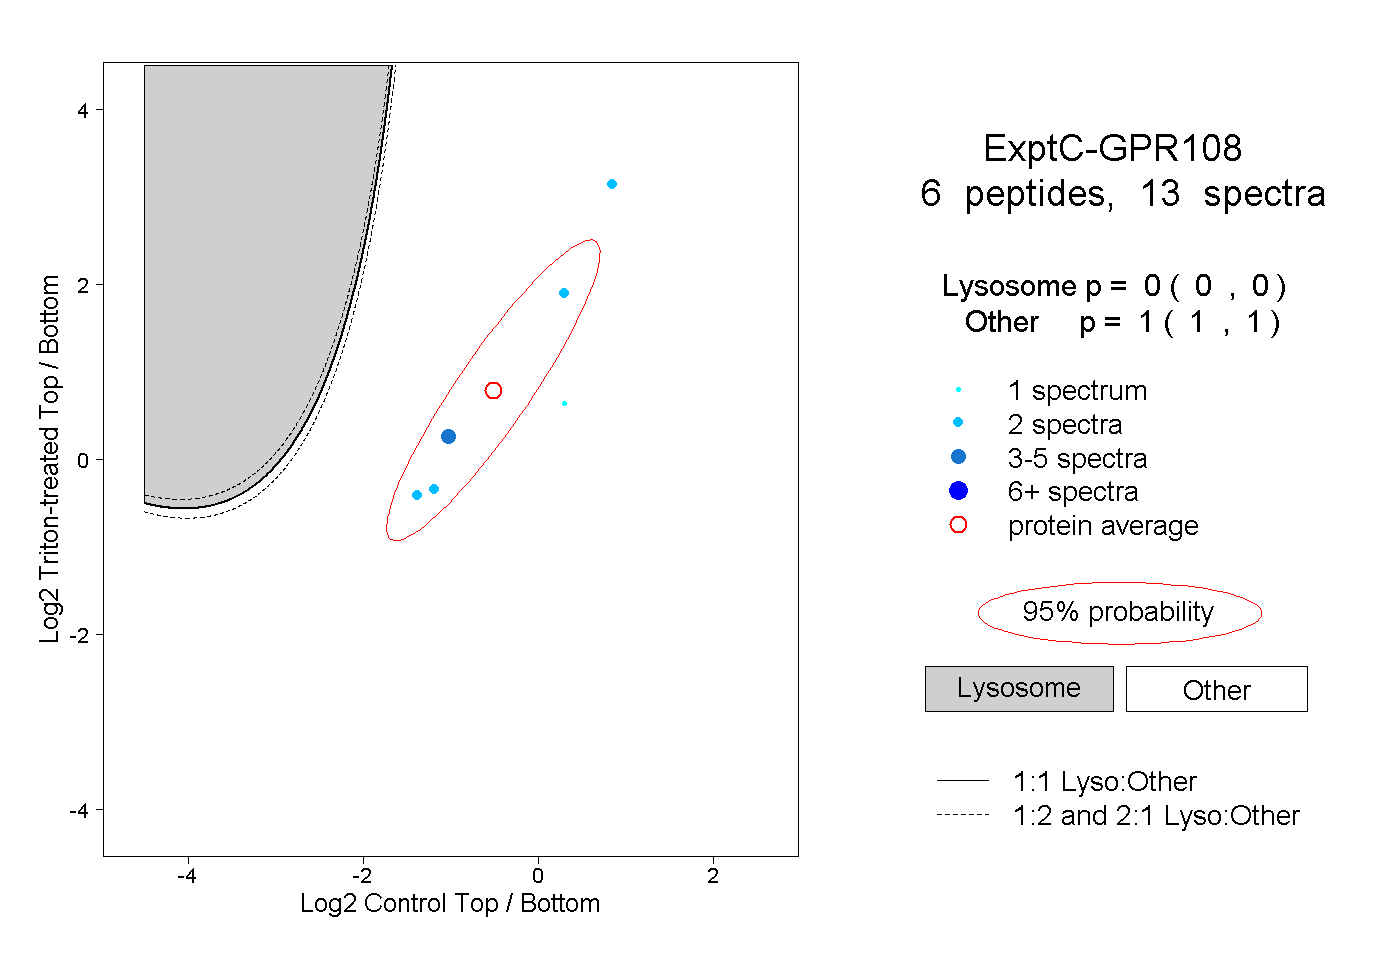
0.000 | 0.000
1.000 | 1.000
1peptide
spectrum
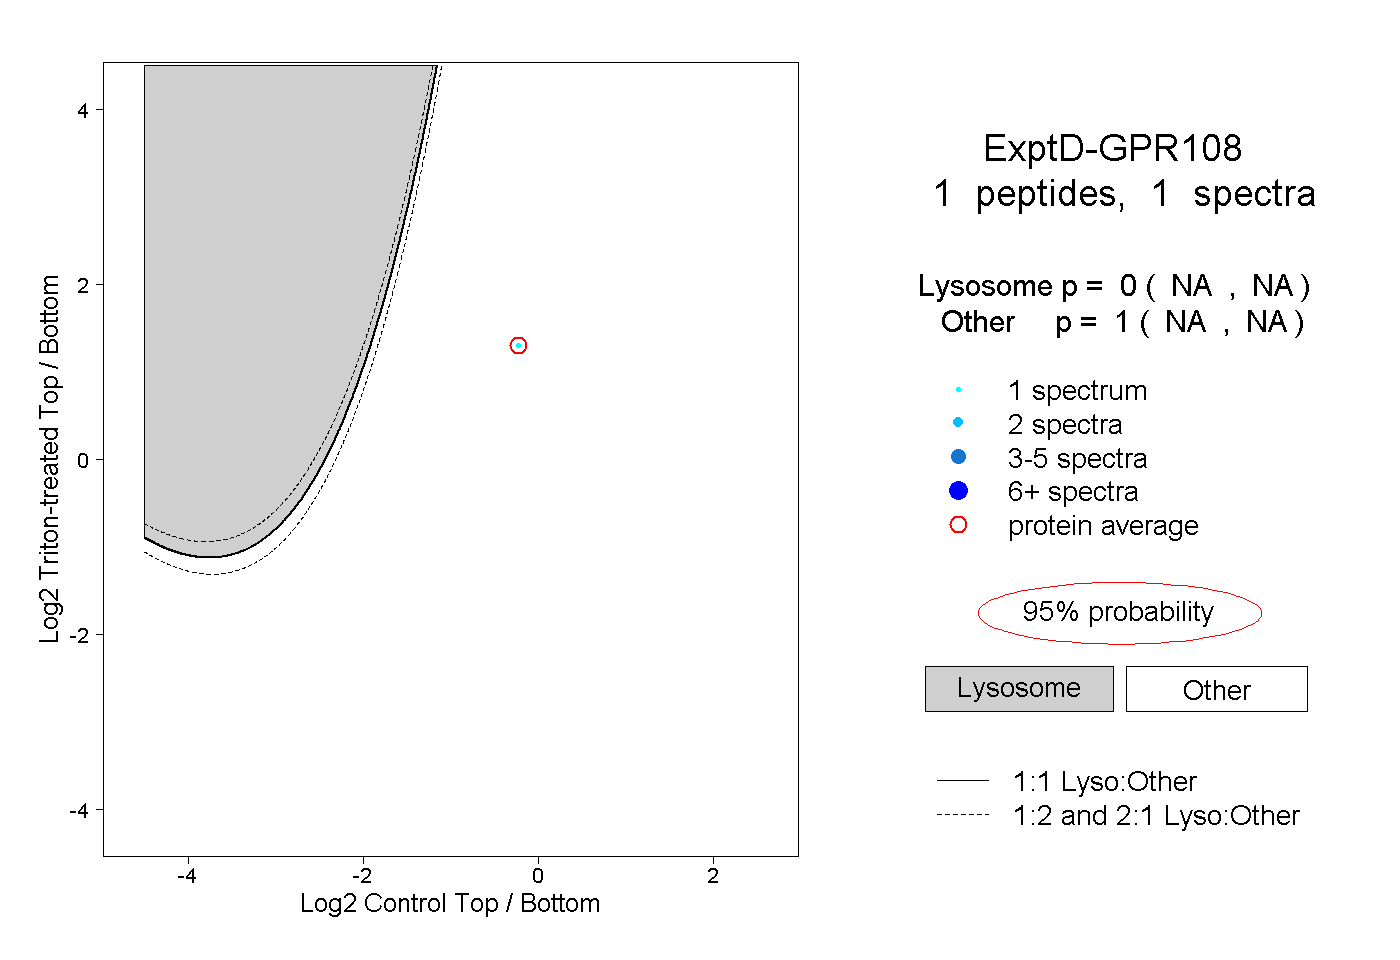
NA | NA
NA | NA