 4
4peptides
spectra
0.000 | 0.000
0.155 | 0.250
0.000 | 0.000
0.000 | 0.083
0.505 | 0.698
0.000 | 0.170
0.021 | 0.131
0.000 | 0.000
| Plot | Mito | Lyso | Perox | ER | Golgi | PM | Cytosol | Nucleus | |||||
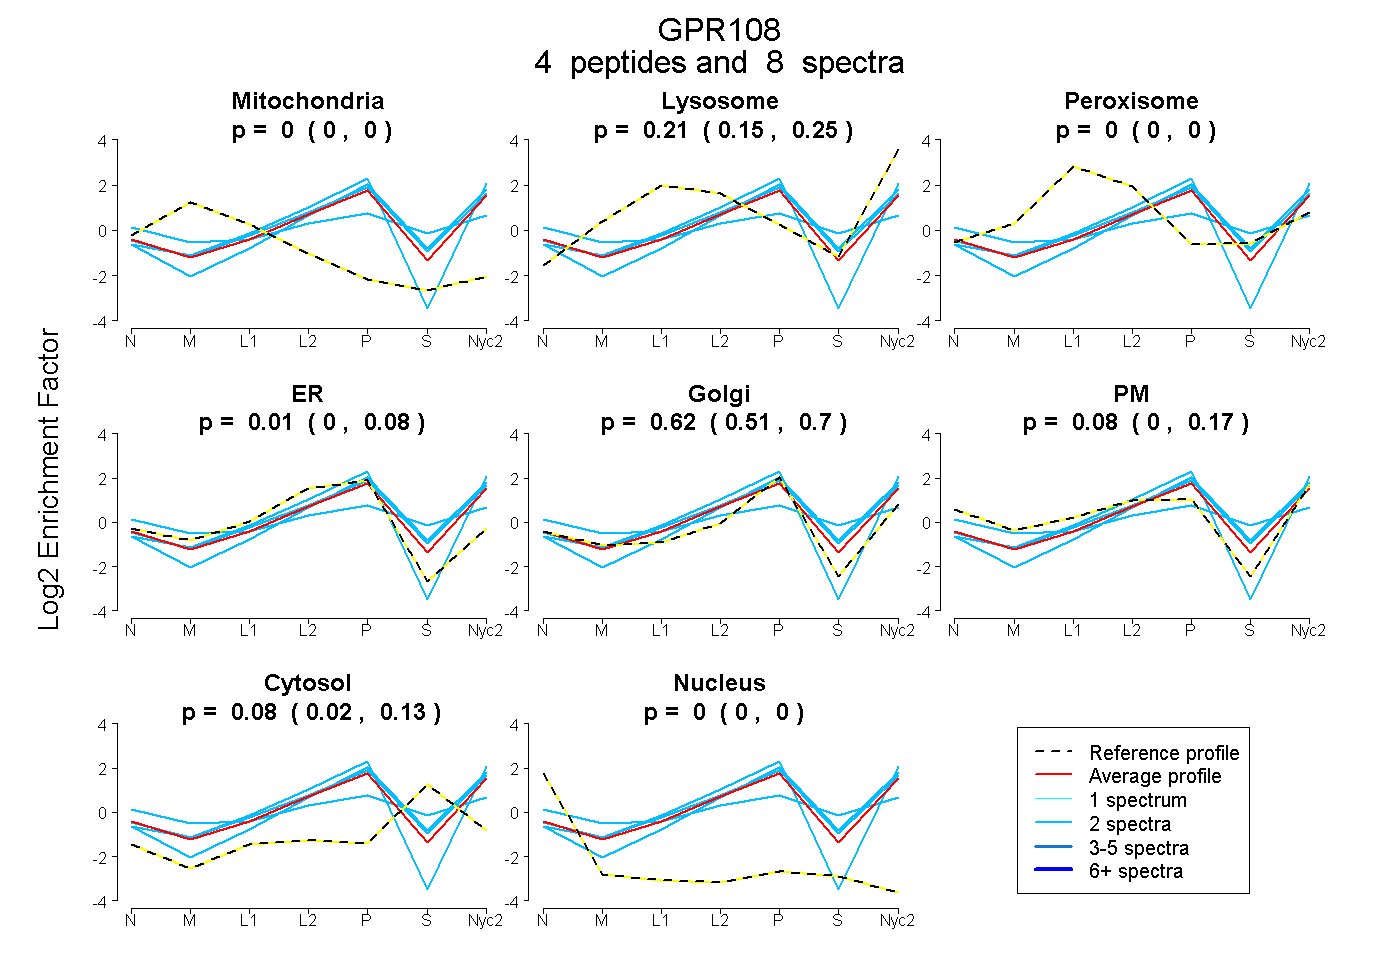
| Expt A |
4 peptides |
8 spectra |
|
0.000 0.000 | 0.000 |
0.206 0.155 | 0.250 |
0.000 0.000 | 0.000 |
0.011 0.000 | 0.083 |
0.620 0.505 | 0.698 |
0.081 0.000 | 0.170 |
0.081 0.021 | 0.131 |
0.000 0.000 | 0.000 |
| 2 spectra, NSHECPLER | 0.000 | 0.000 | 0.112 | 0.000 | 0.106 | 0.455 | 0.327 | 0.000 | ||
| 2 spectra, DLQVQVR | 0.000 | 0.278 | 0.000 | 0.026 | 0.605 | 0.000 | 0.091 | 0.000 | ||
| 2 spectra, ALPAGHR | 0.000 | 0.183 | 0.000 | 0.000 | 0.671 | 0.000 | 0.145 | 0.000 | ||
| 2 spectra, VGFSLSR | 0.000 | 0.140 | 0.000 | 0.085 | 0.565 | 0.210 | 0.000 | 0.000 |
| Plot | Mito | Lyso or Perox | ER | Golgi | PM | Cytosol | Nucleus | ||||||
| Expt B |
2 peptides |
3 spectra |
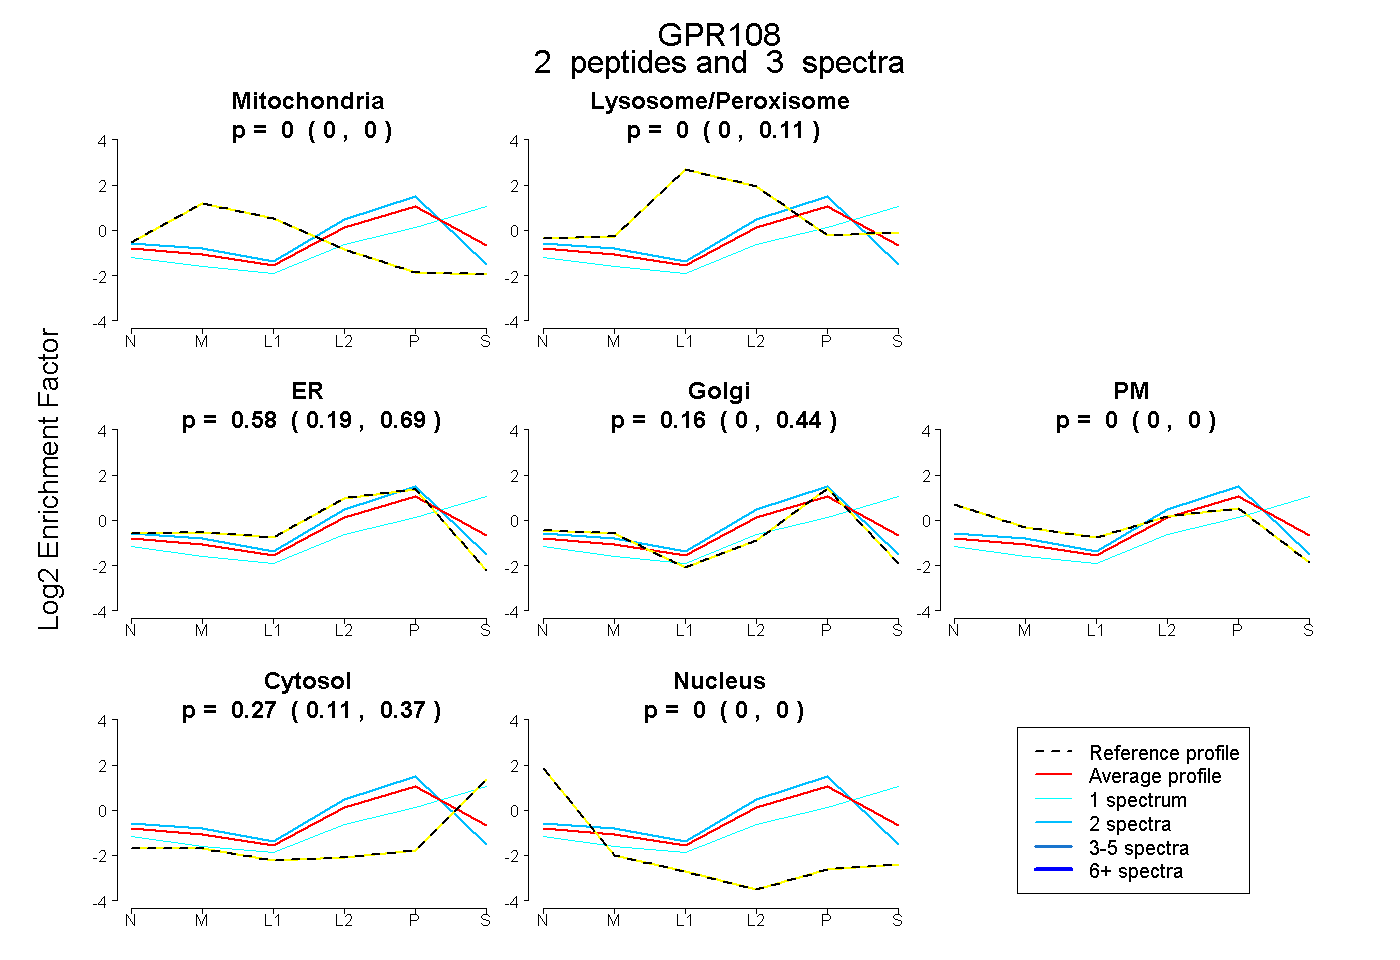 |
0.000 0.000 | 0.000 |
0.000 0.000 | 0.108 |
0.575 0.186 | 0.693 |
0.156 0.000 | 0.444 |
0.000 0.000 | 0.000 |
0.269 0.106 | 0.371 |
0.000 0.000 | 0.000 |
|||
| Plot | Lyso | Other | |||||||||||
| Expt C |
6 peptides |
13 spectra |
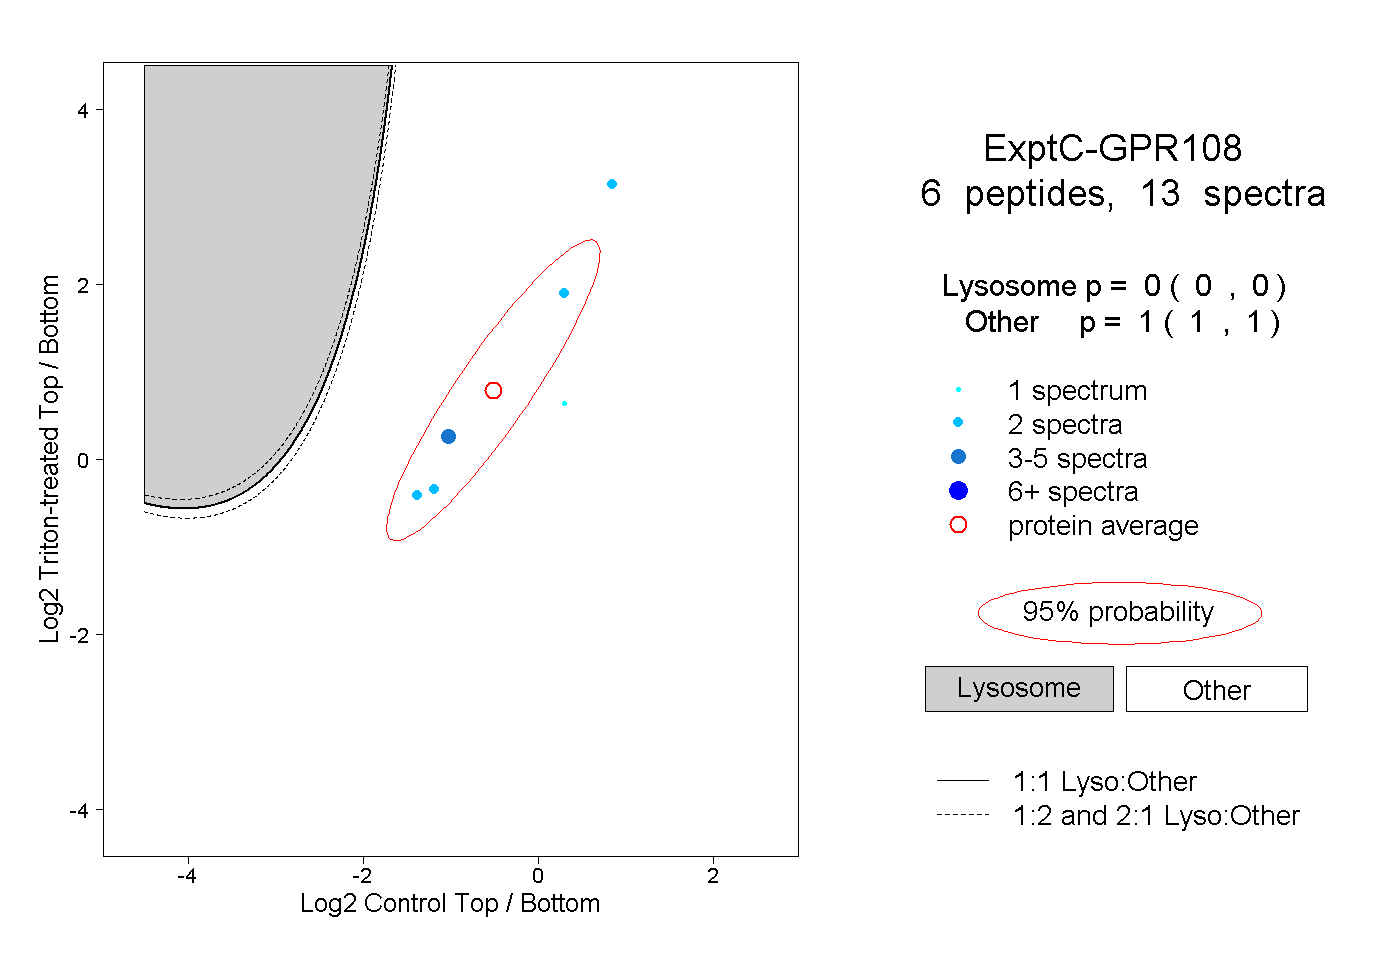 |
0.000 0.000 | 0.000 |
1.000 1.000 | 1.000 |
||||||||
| Plot | Lyso | Other | |||||||||||
| Expt D |
1 peptide |
1 spectrum |
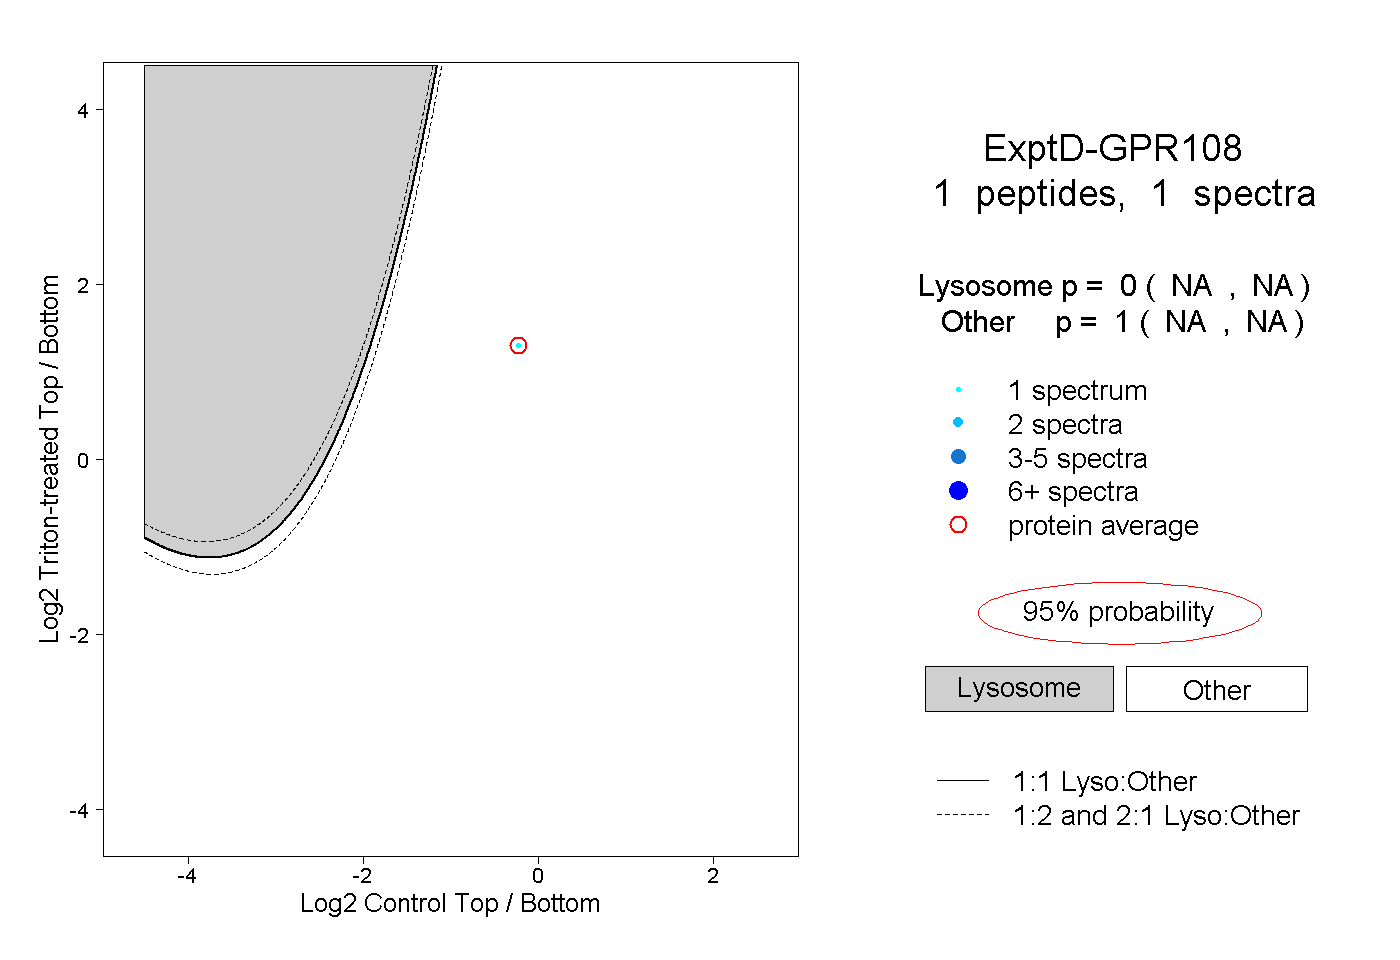 |
0.000 NA | NA |
1.000 NA | NA |