 8
8peptides
spectra
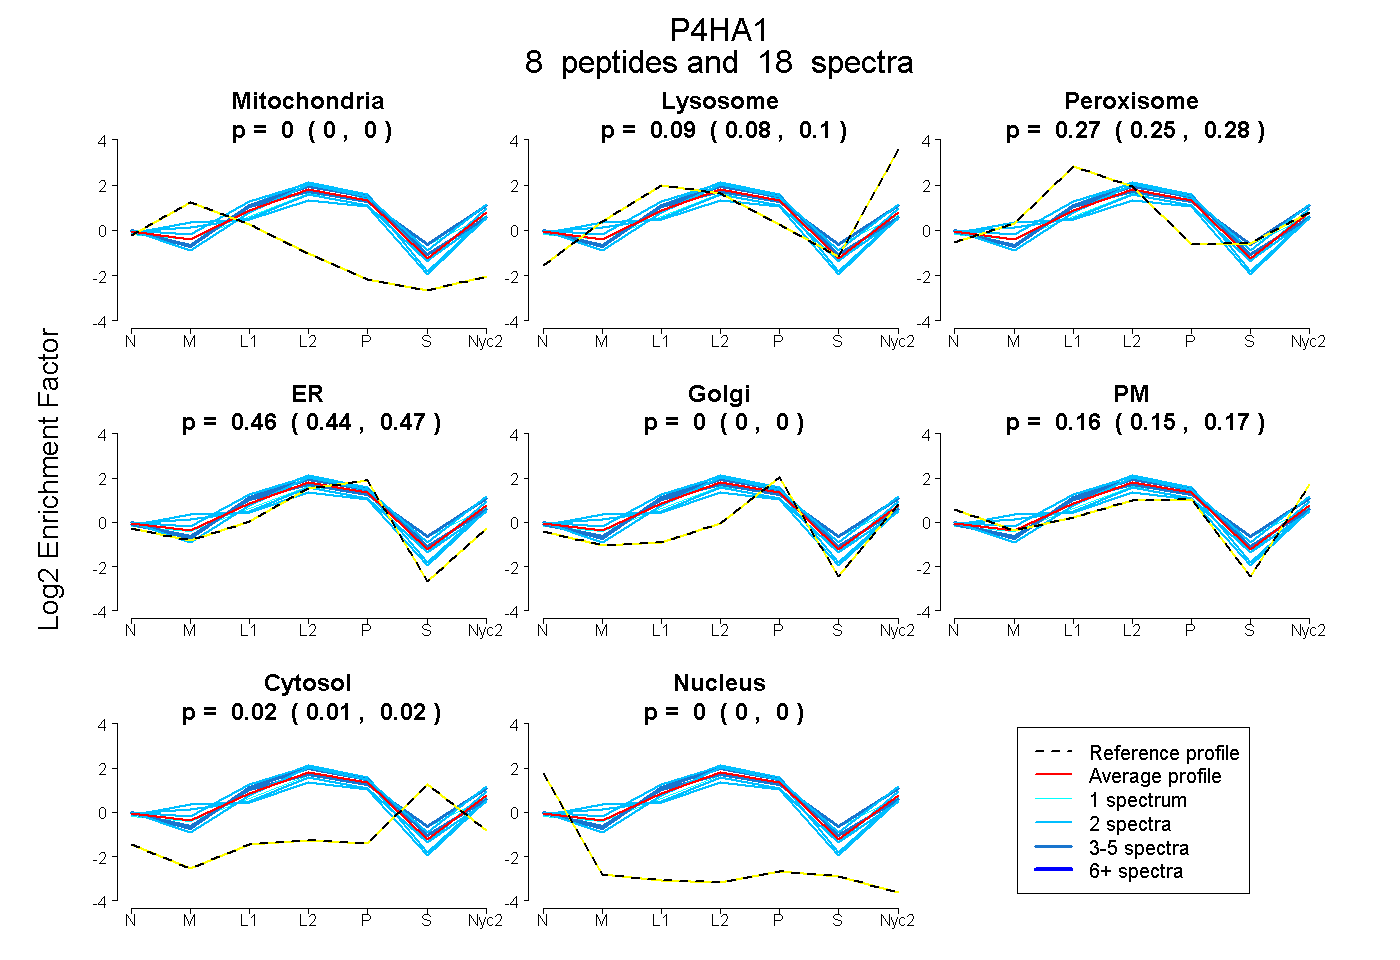
0.000 | 0.000
0.080 | 0.101
0.254 | 0.283
0.445 | 0.474
0.000 | 0.000
0.145 | 0.175
0.007 | 0.025
0.000 | 0.000
2peptides
spectra
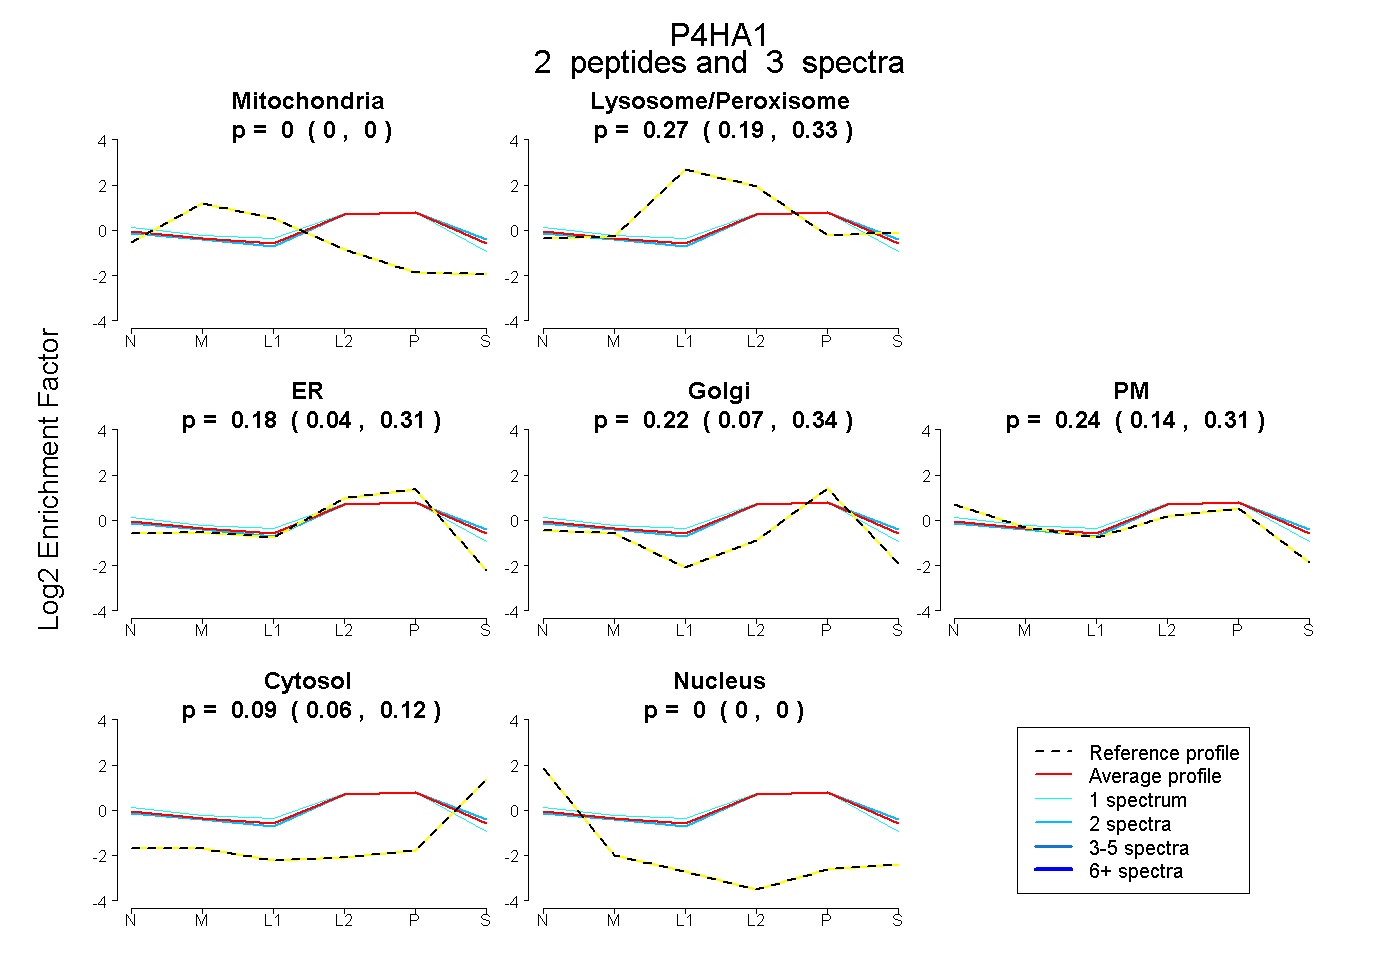
0.000 | 0.000
0.190 | 0.334
0.042 | 0.307
0.067 | 0.344
0.141 | 0.313
0.056 | 0.122
0.000 | 0.000
16peptides
spectra
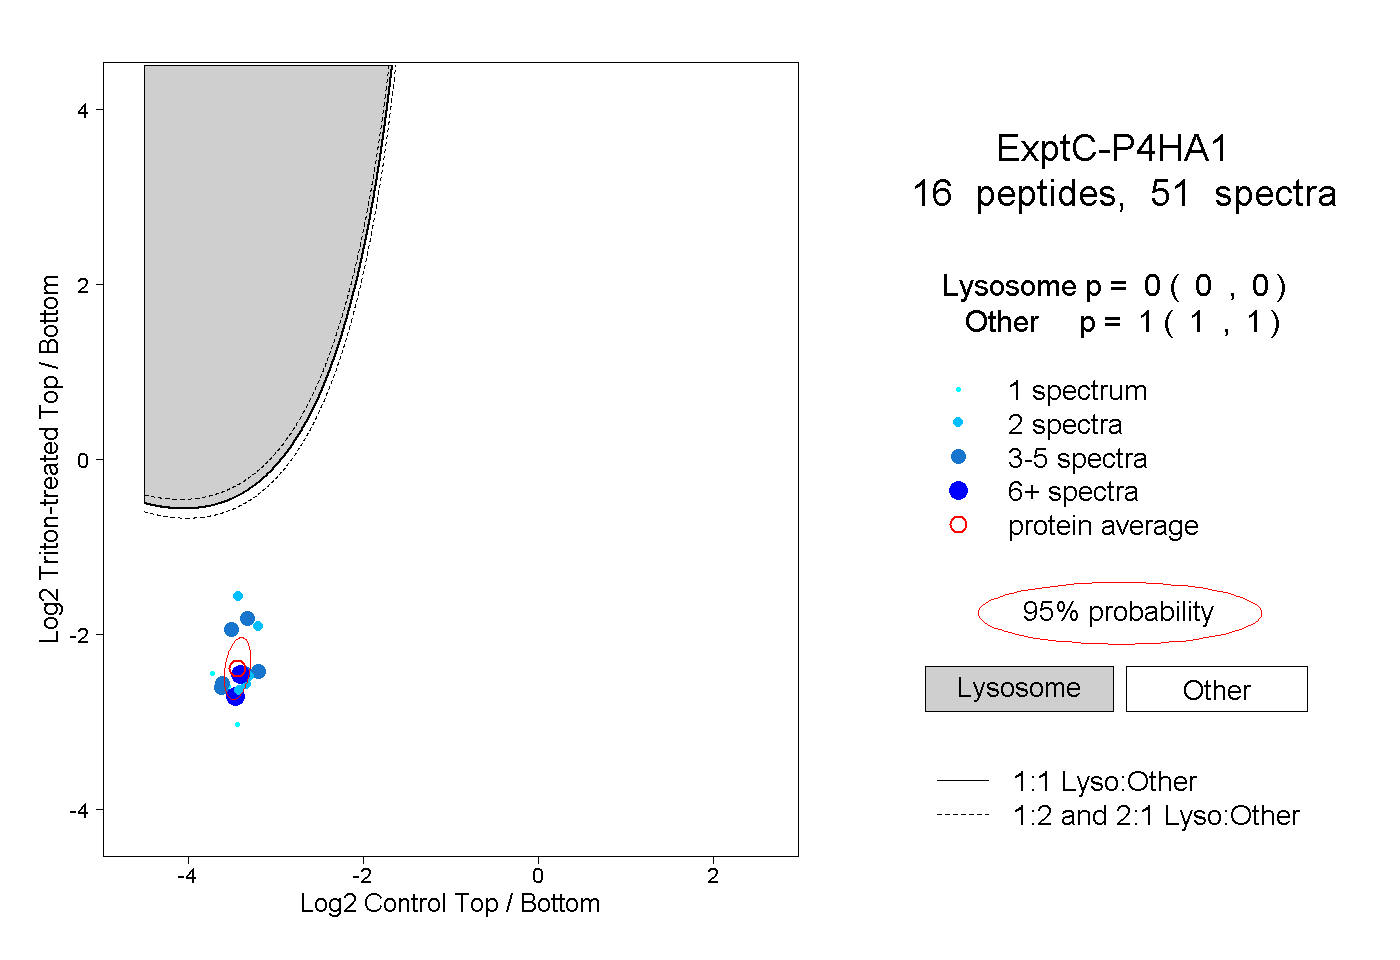
0.000 | 0.000
1.000 | 1.000
2peptides
spectra
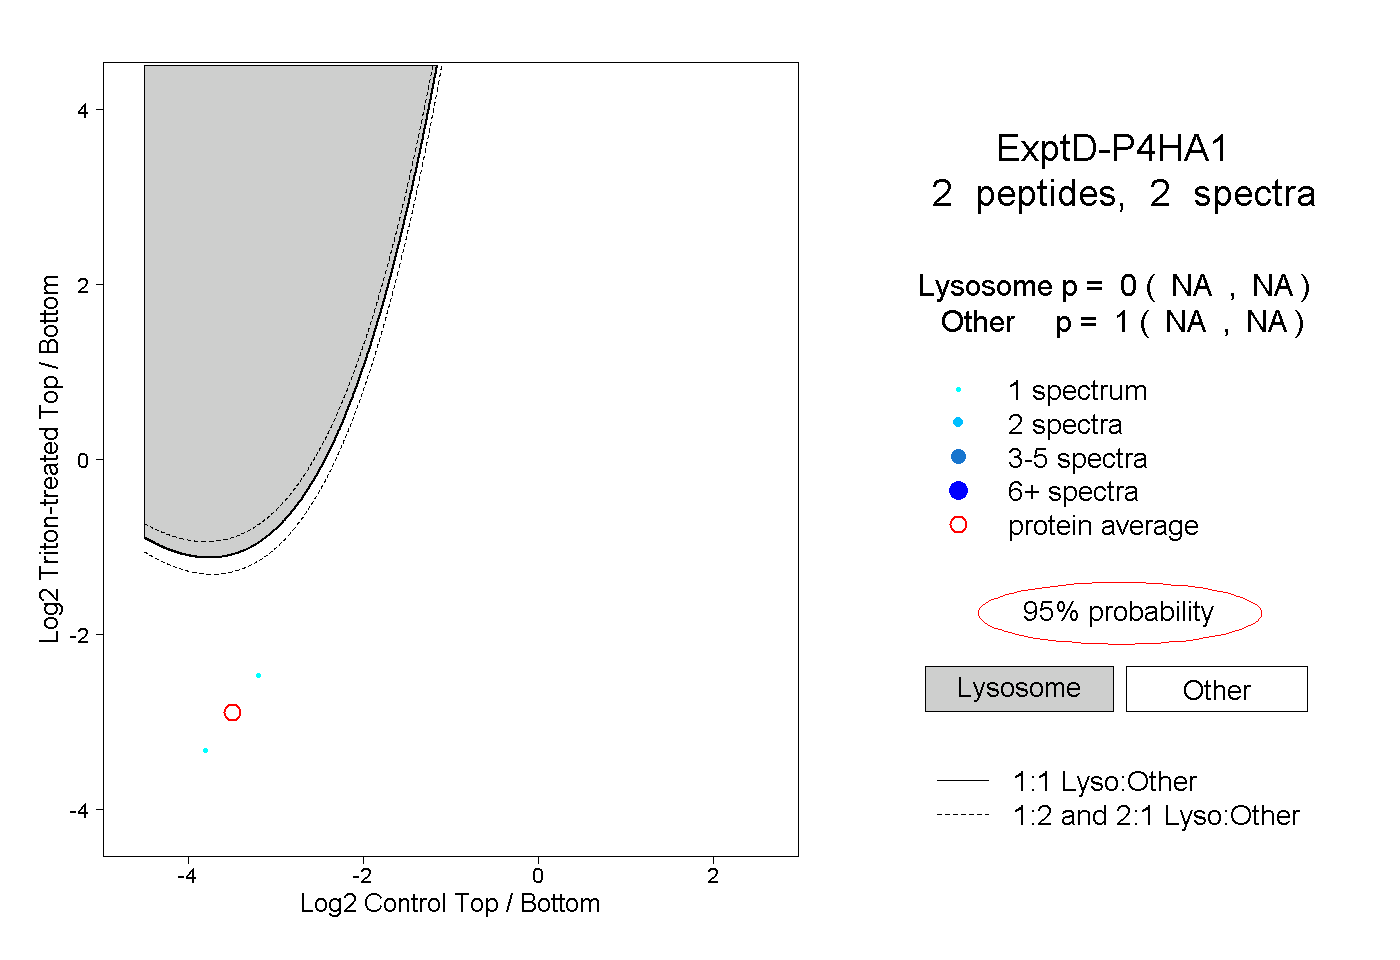
NA | NA
NA | NA