 8
8peptides
spectra
0.000 | 0.000
0.080 | 0.101
0.254 | 0.283
0.445 | 0.474
0.000 | 0.000
0.145 | 0.175
0.007 | 0.025
0.000 | 0.000
| Plot | Mito | Lyso | Perox | ER | Golgi | PM | Cytosol | Nucleus | |||||
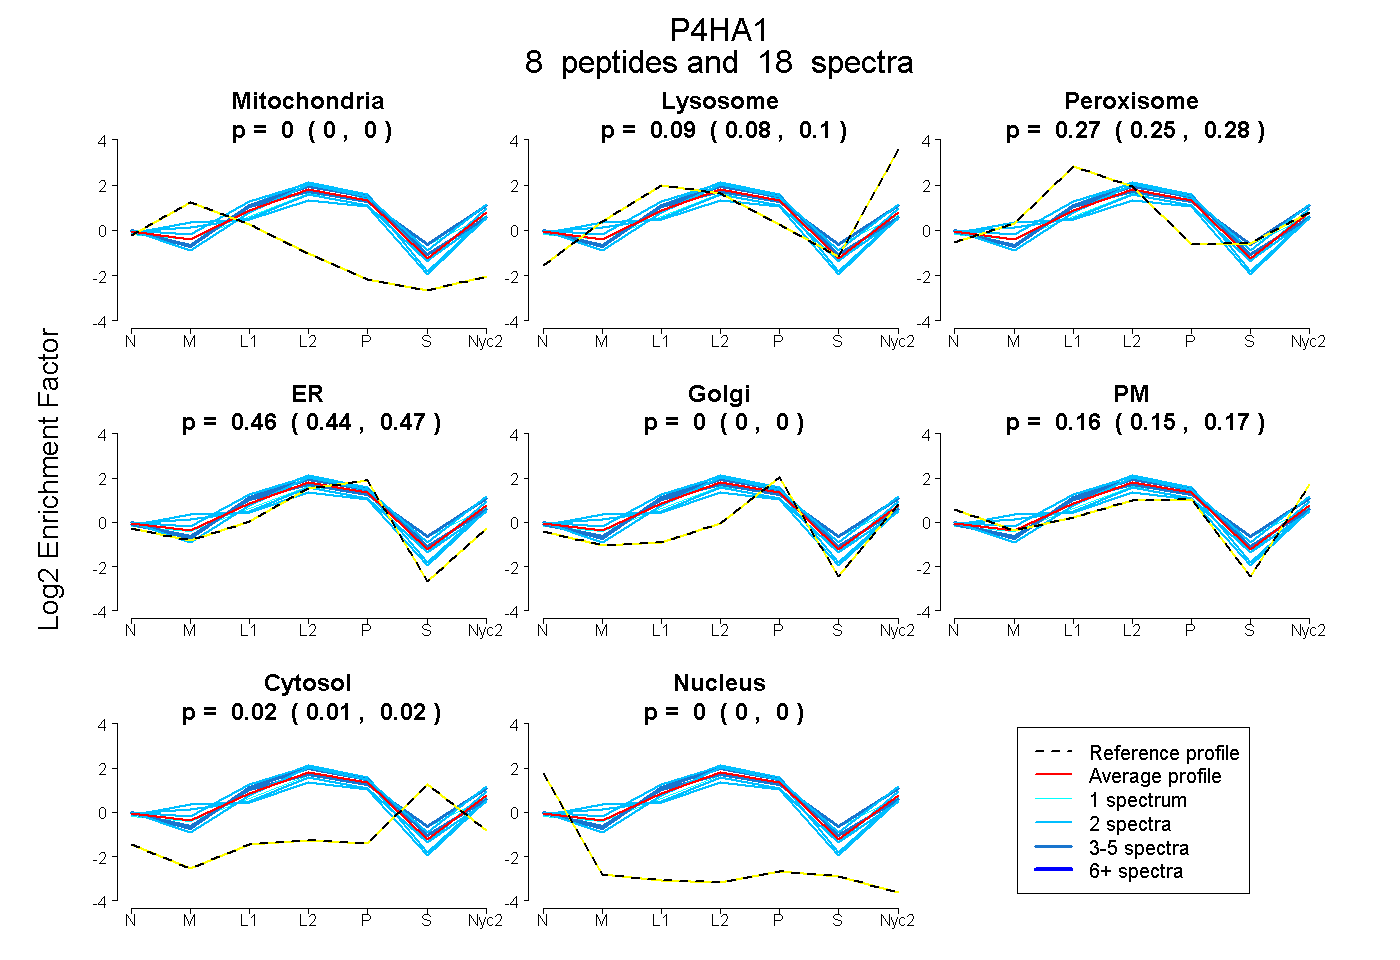
| Expt A |
8 peptides |
18 spectra |
|
0.000 0.000 | 0.000 |
0.091 0.080 | 0.101 |
0.270 0.254 | 0.283 |
0.461 0.445 | 0.474 |
0.000 0.000 | 0.000 |
0.161 0.145 | 0.175 |
0.017 0.007 | 0.025 |
0.000 0.000 | 0.000 |
| 2 spectra, HAACPVLVGNK | 0.000 | 0.095 | 0.216 | 0.319 | 0.000 | 0.343 | 0.027 | 0.000 | ||
| 1 spectrum, DEPDAFR | 0.000 | 0.127 | 0.237 | 0.446 | 0.000 | 0.086 | 0.103 | 0.000 | ||
| 2 spectra, LLELDPEHQR | 0.100 | 0.115 | 0.116 | 0.420 | 0.000 | 0.249 | 0.000 | 0.000 | ||
| 3 spectra, LTTAQYR | 0.000 | 0.173 | 0.270 | 0.338 | 0.000 | 0.144 | 0.076 | 0.000 | ||
| 2 spectra, SASGDQSDQK | 0.000 | 0.200 | 0.163 | 0.446 | 0.000 | 0.139 | 0.052 | 0.000 | ||
| 2 spectra, ALLLTK | 0.000 | 0.062 | 0.306 | 0.617 | 0.000 | 0.015 | 0.000 | 0.000 | ||
| 4 spectra, GIAVDYLPER | 0.000 | 0.063 | 0.329 | 0.553 | 0.000 | 0.042 | 0.013 | 0.000 | ||
| 2 spectra, DPEGFVGHPVNAFK | 0.000 | 0.072 | 0.304 | 0.530 | 0.000 | 0.093 | 0.000 | 0.000 |
| Plot | Mito | Lyso or Perox | ER | Golgi | PM | Cytosol | Nucleus | ||||||
| Expt B |
2 peptides |
3 spectra |
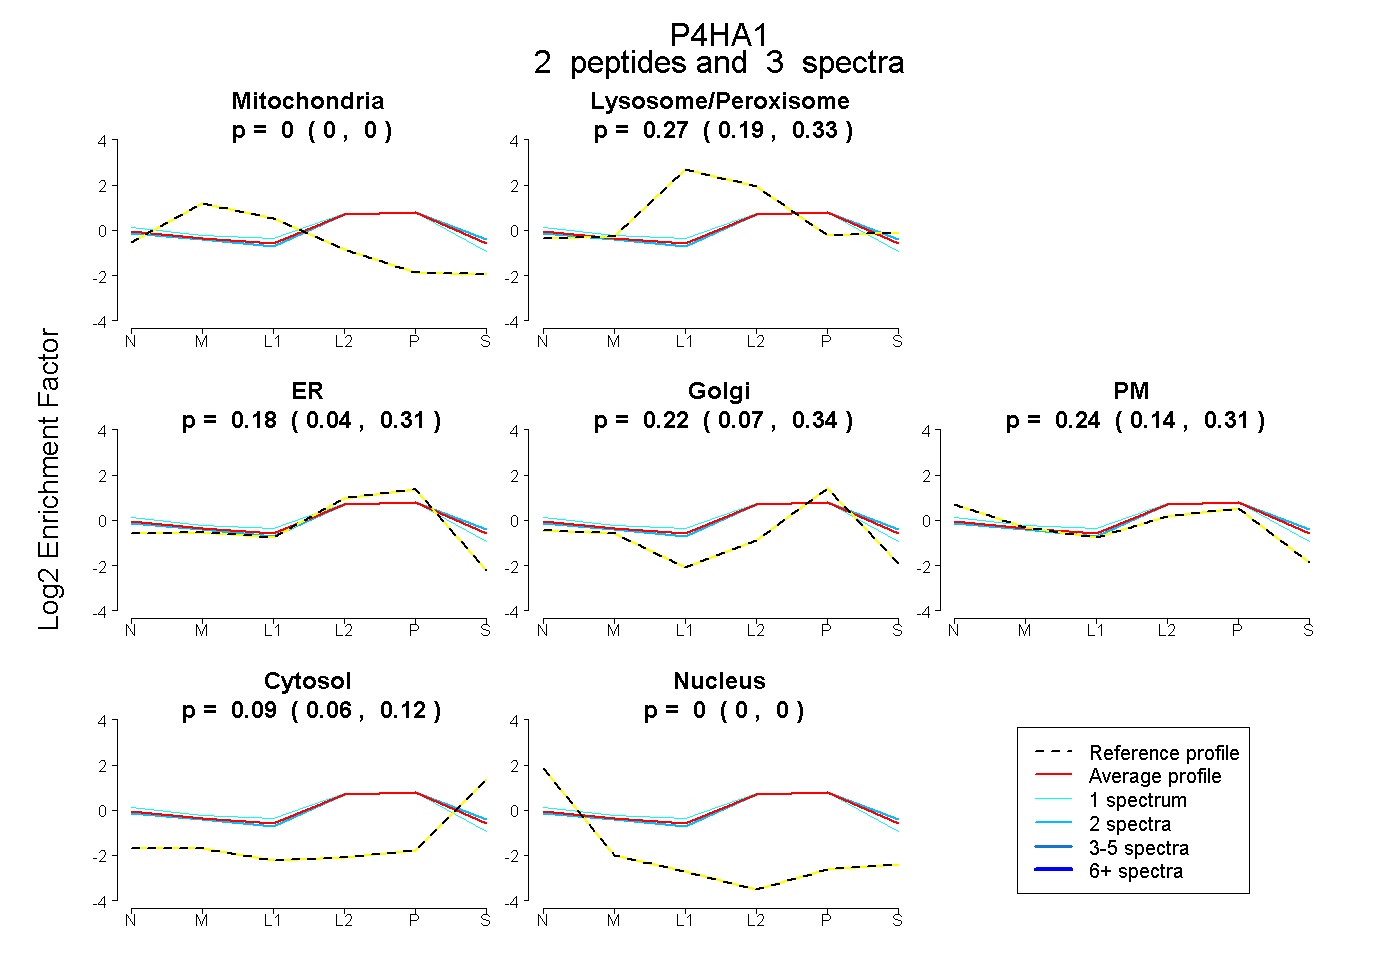 |
0.000 0.000 | 0.000 |
0.270 0.190 | 0.334 |
0.184 0.042 | 0.307 |
0.218 0.067 | 0.344 |
0.236 0.141 | 0.313 |
0.091 0.056 | 0.122 |
0.000 0.000 | 0.000 |
|||
| Plot | Lyso | Other | |||||||||||
| Expt C |
16 peptides |
51 spectra |
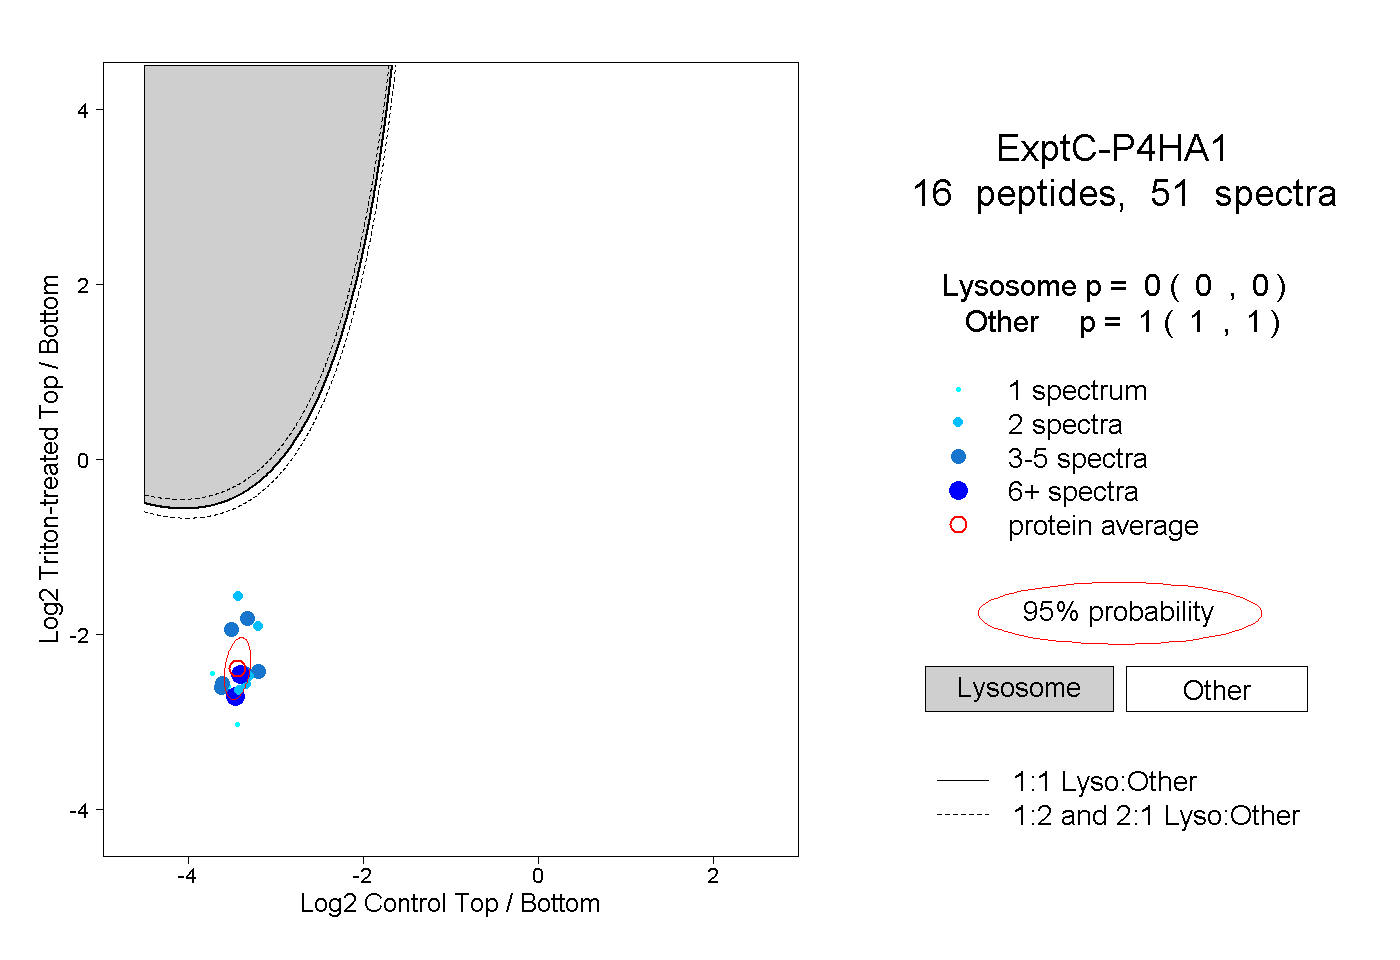 |
0.000 0.000 | 0.000 |
1.000 1.000 | 1.000 |
||||||||
| Plot | Lyso | Other | |||||||||||
| Expt D |
2 peptides |
2 spectra |
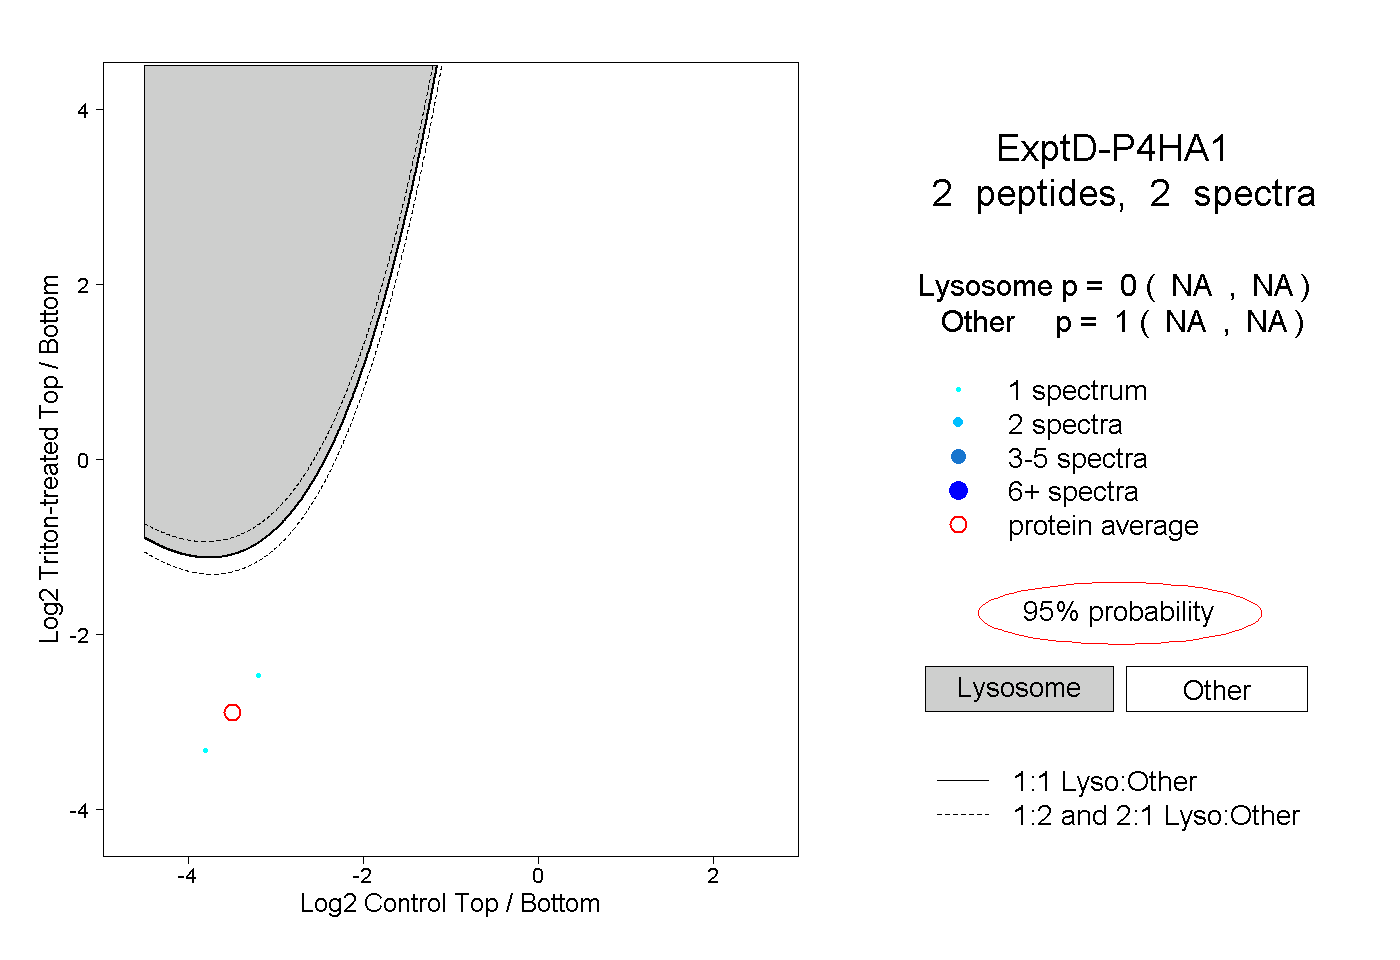 |
0.000 NA | NA |
1.000 NA | NA |