 13
13peptides
spectra
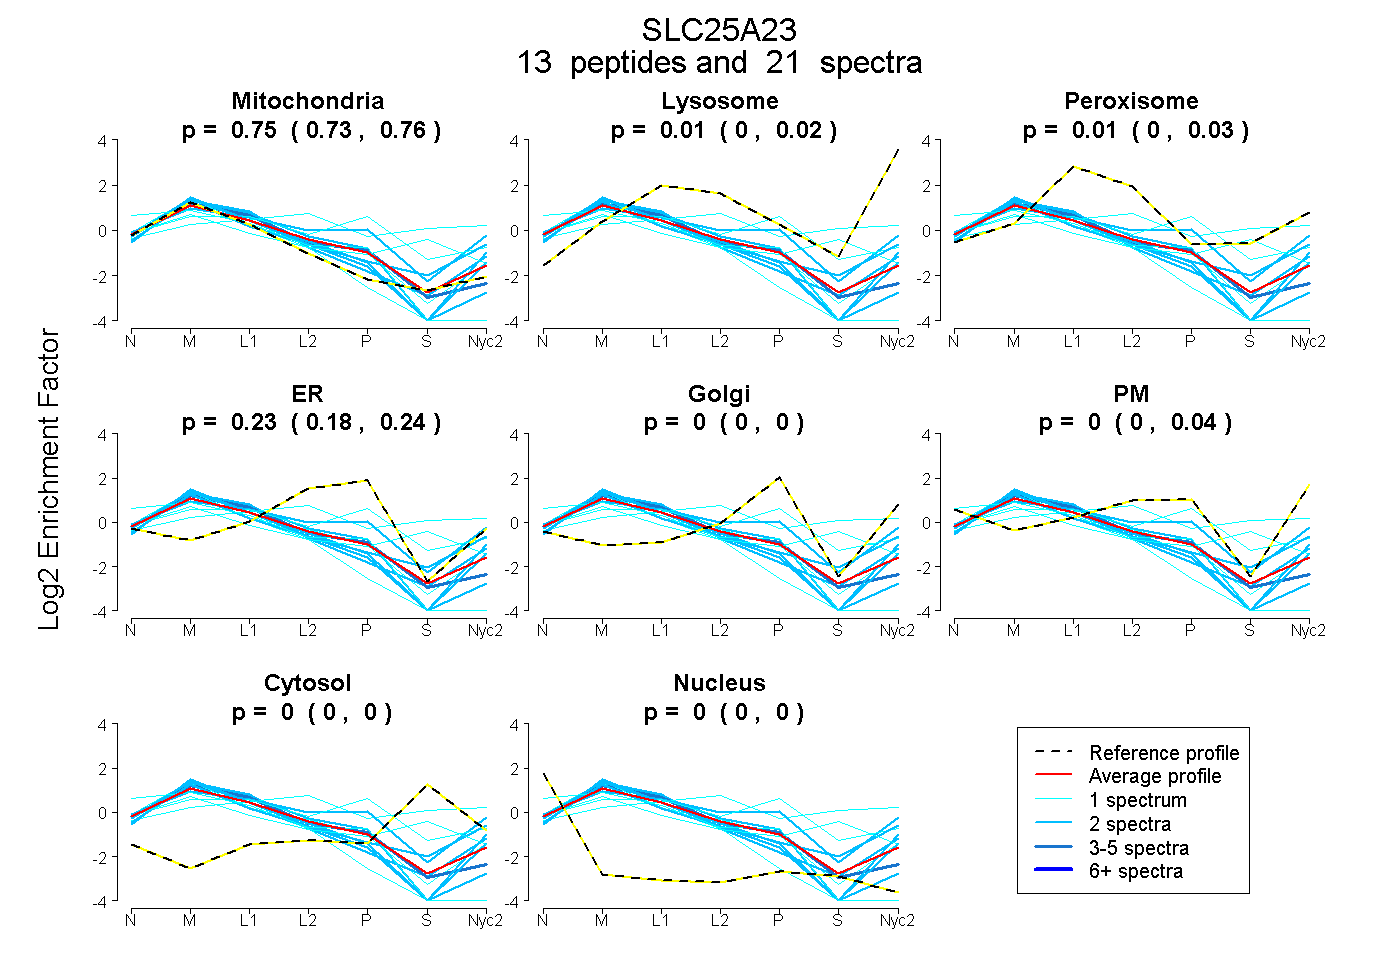
0.734 | 0.765
0.000 | 0.024
0.000 | 0.032
0.184 | 0.243
0.000 | 0.000
0.000 | 0.036
0.000 | 0.000
0.000 | 0.000
4peptides
spectra
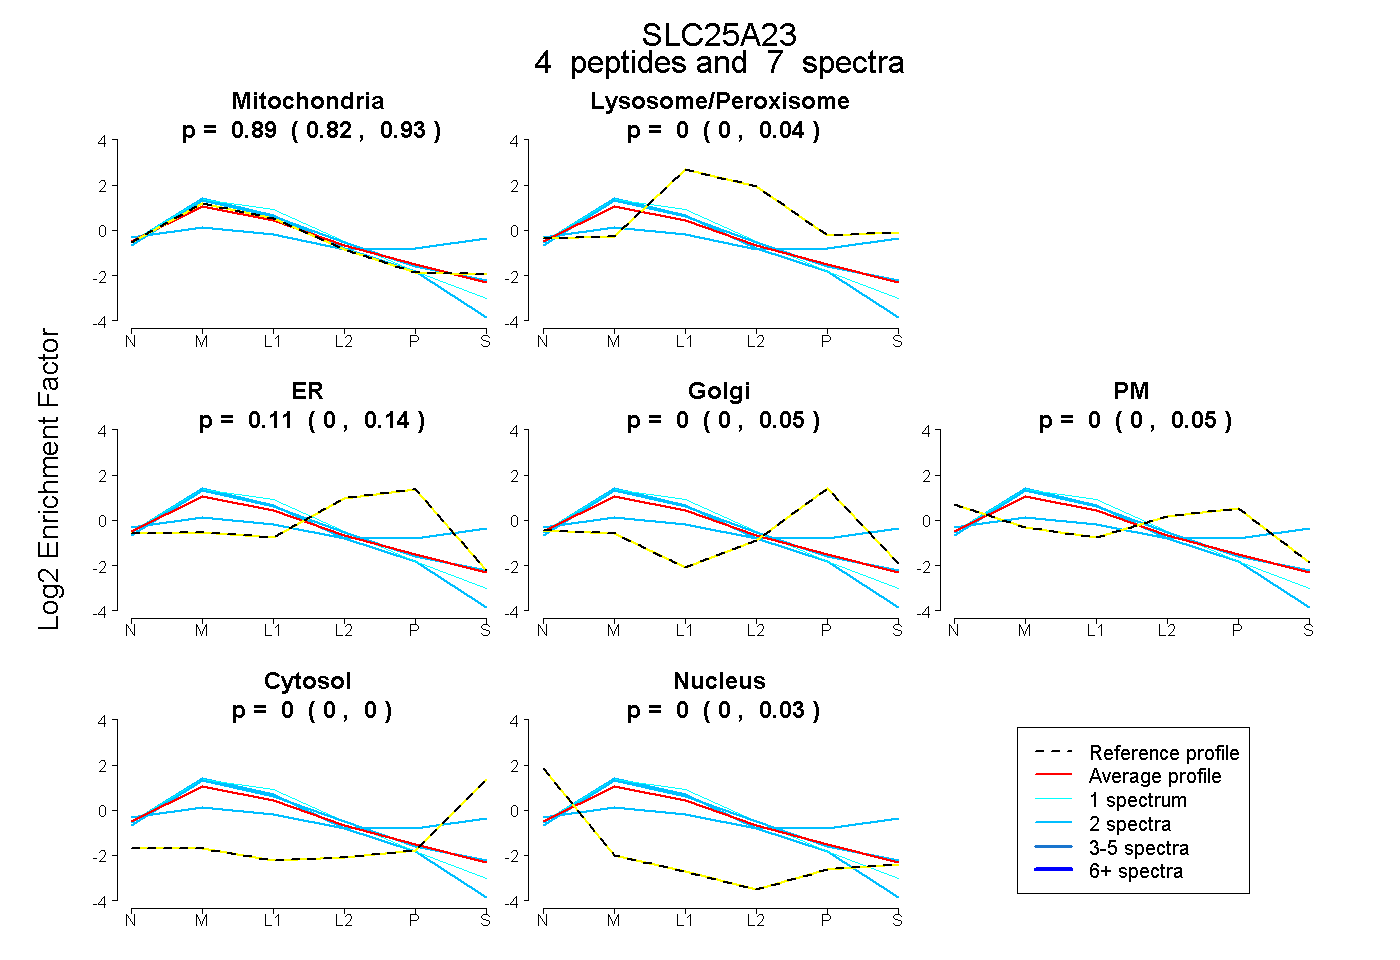
0.822 | 0.928
0.000 | 0.041
0.000 | 0.140
0.000 | 0.049
0.000 | 0.046
0.000 | 0.000
0.000 | 0.029
10peptides
spectra
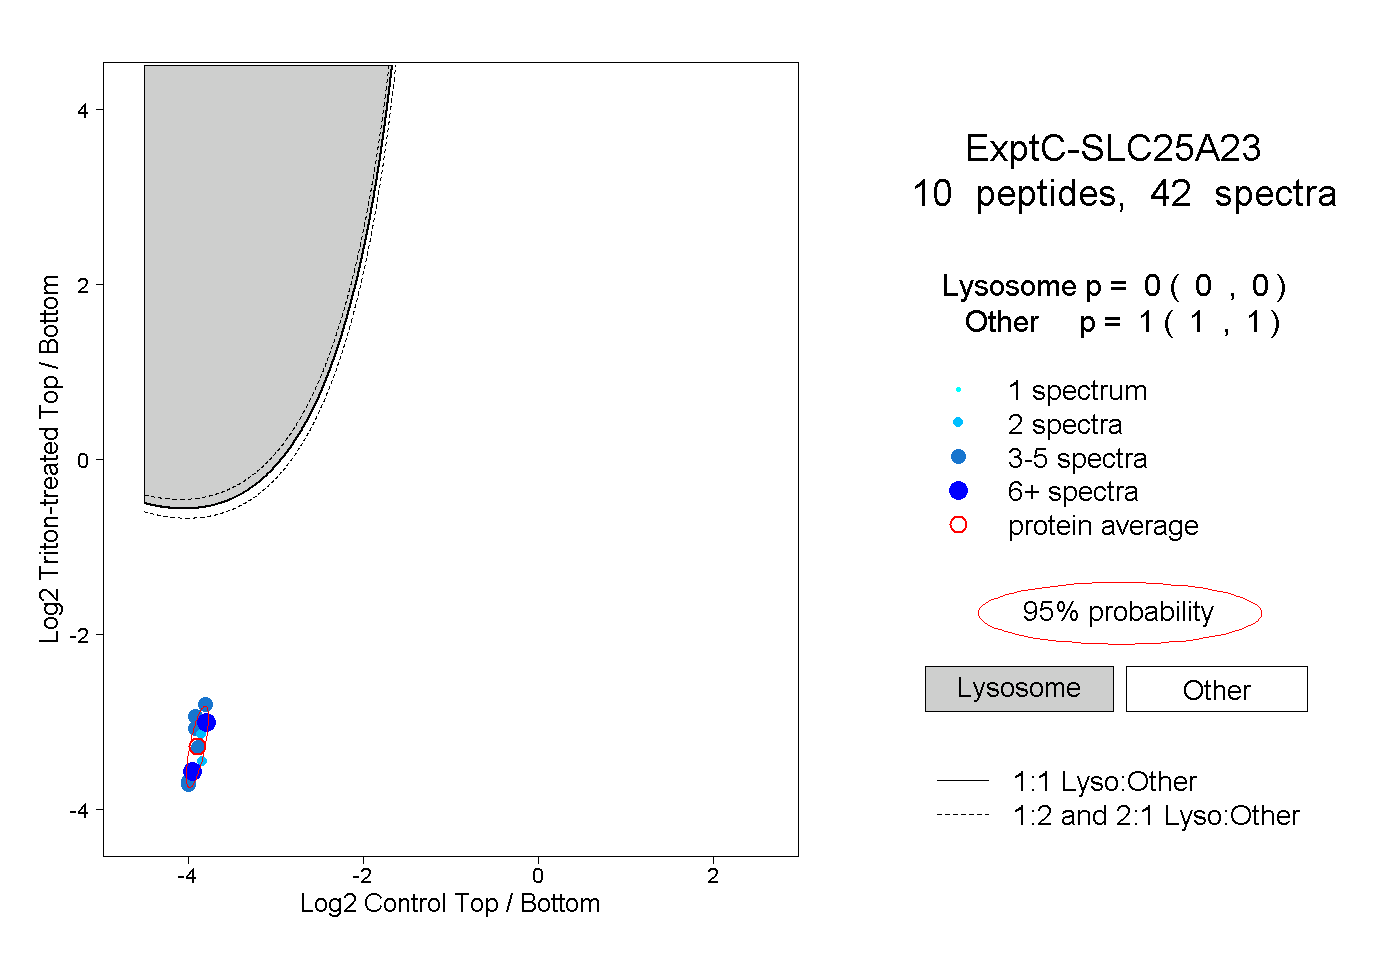
0.000 | 0.000
1.000 | 1.000
3peptides
spectra
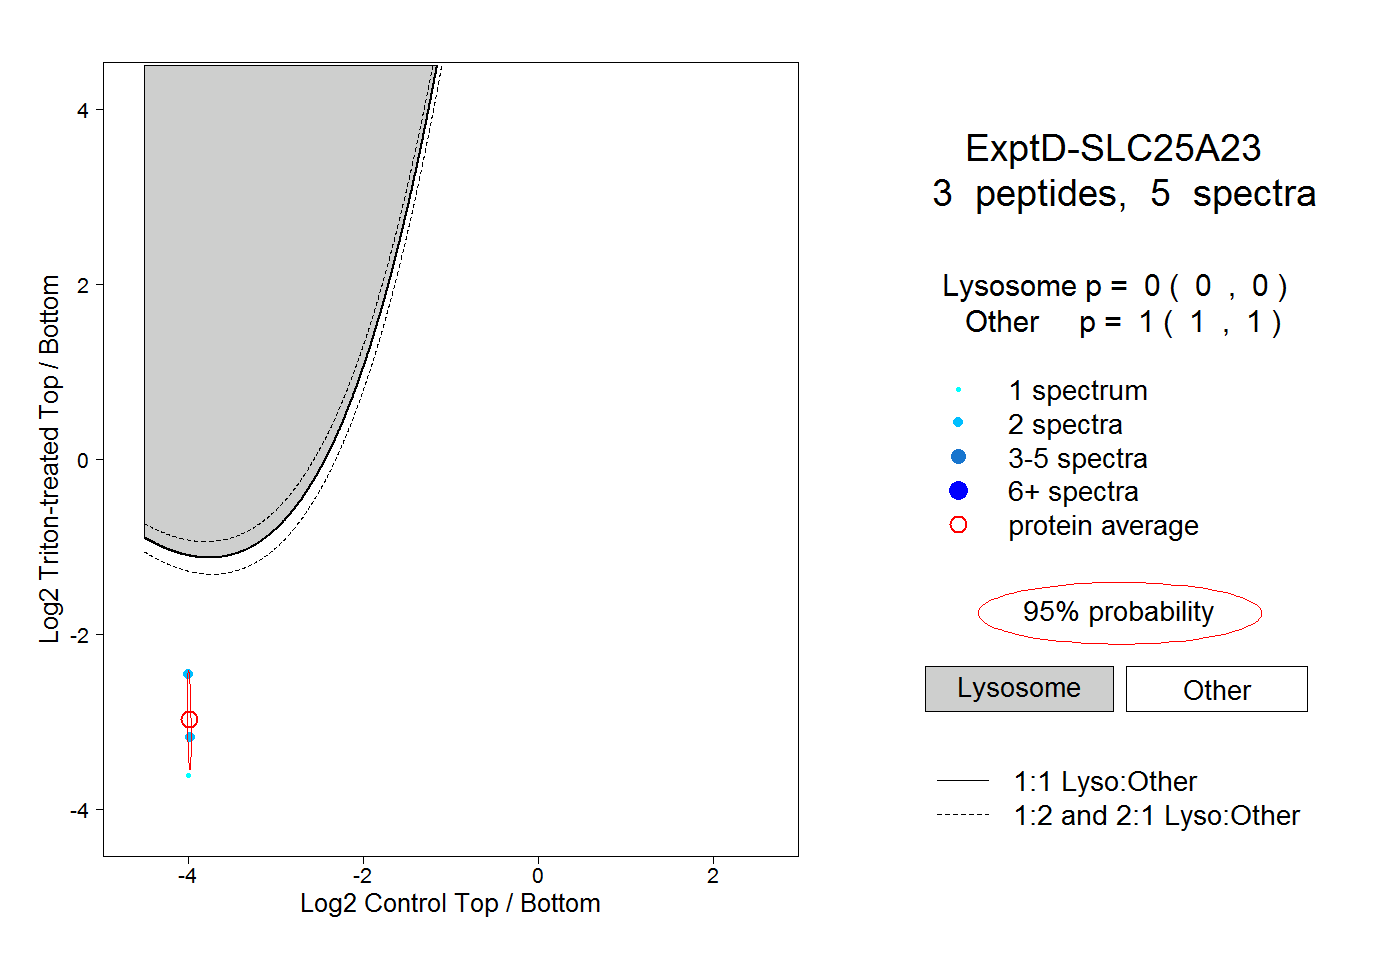
0.000 | 0.000
1.000 | 1.000