 13
13peptides
spectra
0.734 | 0.765
0.000 | 0.024
0.000 | 0.032
0.184 | 0.243
0.000 | 0.000
0.000 | 0.036
0.000 | 0.000
0.000 | 0.000
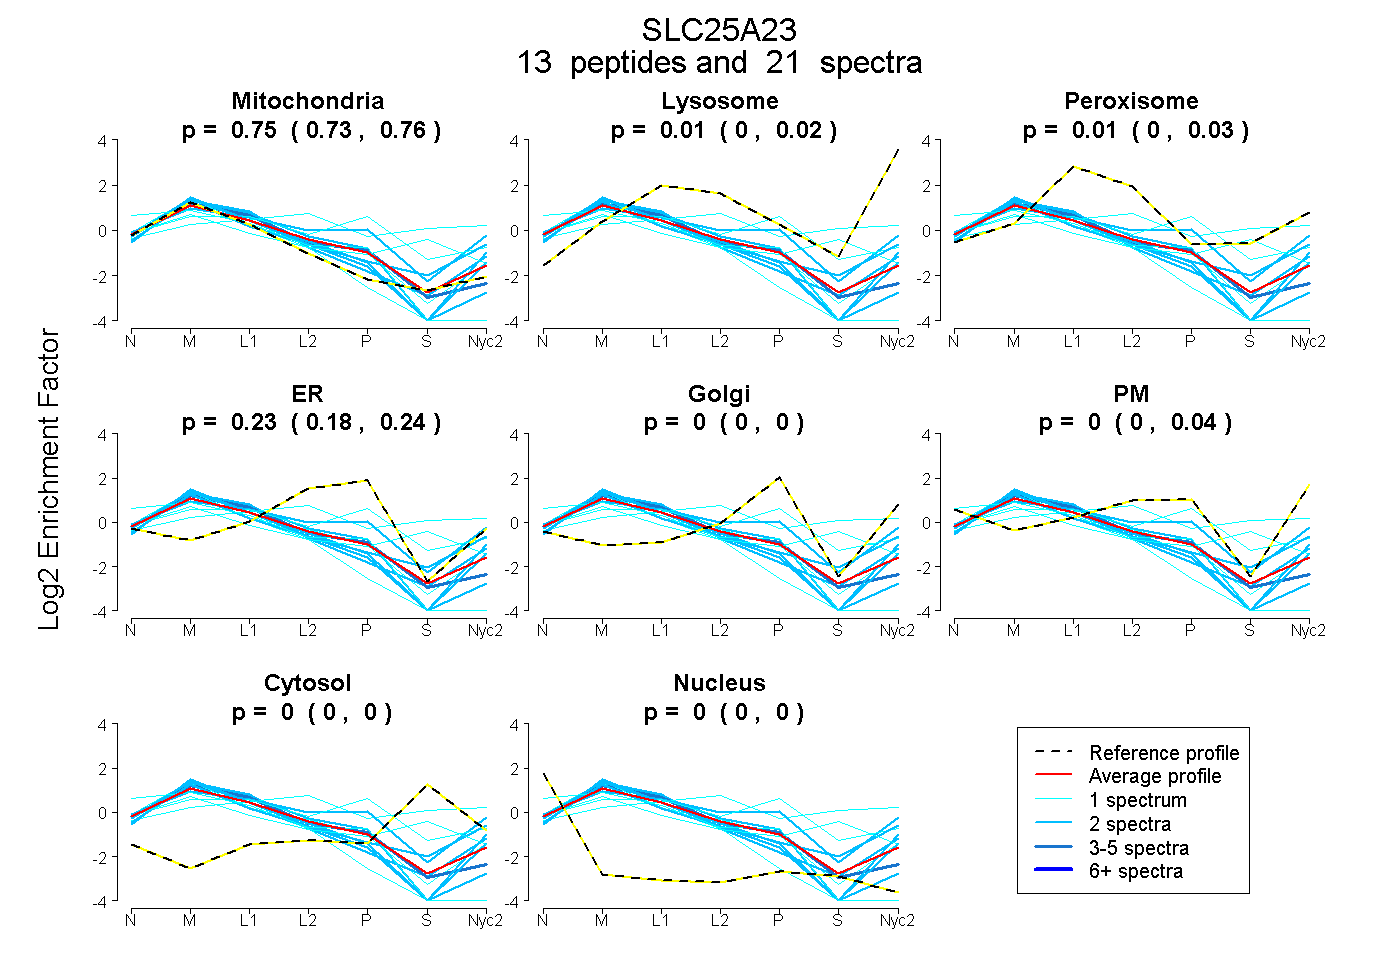
| Plot | Mito | Lyso | Perox | ER | Golgi | PM | Cytosol | Nucleus | |||||
| Expt A |
13 peptides |
21 spectra |
|
0.751 0.734 | 0.765 |
0.008 0.000 | 0.024 |
0.011 0.000 | 0.032 |
0.226 0.184 | 0.243 |
0.000 0.000 | 0.000 |
0.004 0.000 | 0.036 |
0.000 0.000 | 0.000 |
0.000 0.000 | 0.000 |
| 2 spectra, ILHSMDR | 0.459 | 0.096 | 0.041 | 0.114 | 0.065 | 0.225 | 0.000 | 0.000 | ||
| 1 spectrum, TGTAPLDR | 0.535 | 0.000 | 0.140 | 0.000 | 0.024 | 0.000 | 0.301 | 0.000 | ||
| 2 spectra, QALGVTSR | 0.853 | 0.000 | 0.000 | 0.030 | 0.000 | 0.117 | 0.000 | 0.000 | ||
| 1 spectrum, IAPESAIK | 0.926 | 0.000 | 0.000 | 0.000 | 0.000 | 0.000 | 0.000 | 0.074 | ||
| 2 spectra, GLAPNFMK | 0.861 | 0.131 | 0.000 | 0.000 | 0.000 | 0.008 | 0.000 | 0.000 | ||
| 2 spectra, NMVQEGGLLSLWR | 0.723 | 0.191 | 0.000 | 0.000 | 0.058 | 0.000 | 0.028 | 0.000 | ||
| 1 spectrum, HILSQEGVWGLYR | 0.069 | 0.000 | 0.460 | 0.000 | 0.028 | 0.162 | 0.281 | 0.000 | ||
| 3 spectra, GLLDCAR | 0.805 | 0.000 | 0.000 | 0.195 | 0.000 | 0.000 | 0.000 | 0.000 | ||
| 1 spectrum, DGTMTIDWQEWR | 0.753 | 0.000 | 0.000 | 0.202 | 0.000 | 0.045 | 0.000 | 0.000 | ||
| 2 spectra, LTGMWWK | 0.794 | 0.032 | 0.000 | 0.017 | 0.000 | 0.156 | 0.000 | 0.000 | ||
| 1 spectrum, VDVHELR | 0.727 | 0.000 | 0.000 | 0.138 | 0.000 | 0.000 | 0.000 | 0.135 | ||
| 1 spectrum, LLLMFHSLDR | 0.334 | 0.000 | 0.238 | 0.079 | 0.317 | 0.000 | 0.033 | 0.000 | ||
| 2 spectra, AICGQQETLHVQER | 0.801 | 0.000 | 0.000 | 0.199 | 0.000 | 0.000 | 0.000 | 0.000 |
| Plot | Mito | Lyso or Perox | ER | Golgi | PM | Cytosol | Nucleus | ||||||
| Expt B |
4 peptides |
7 spectra |
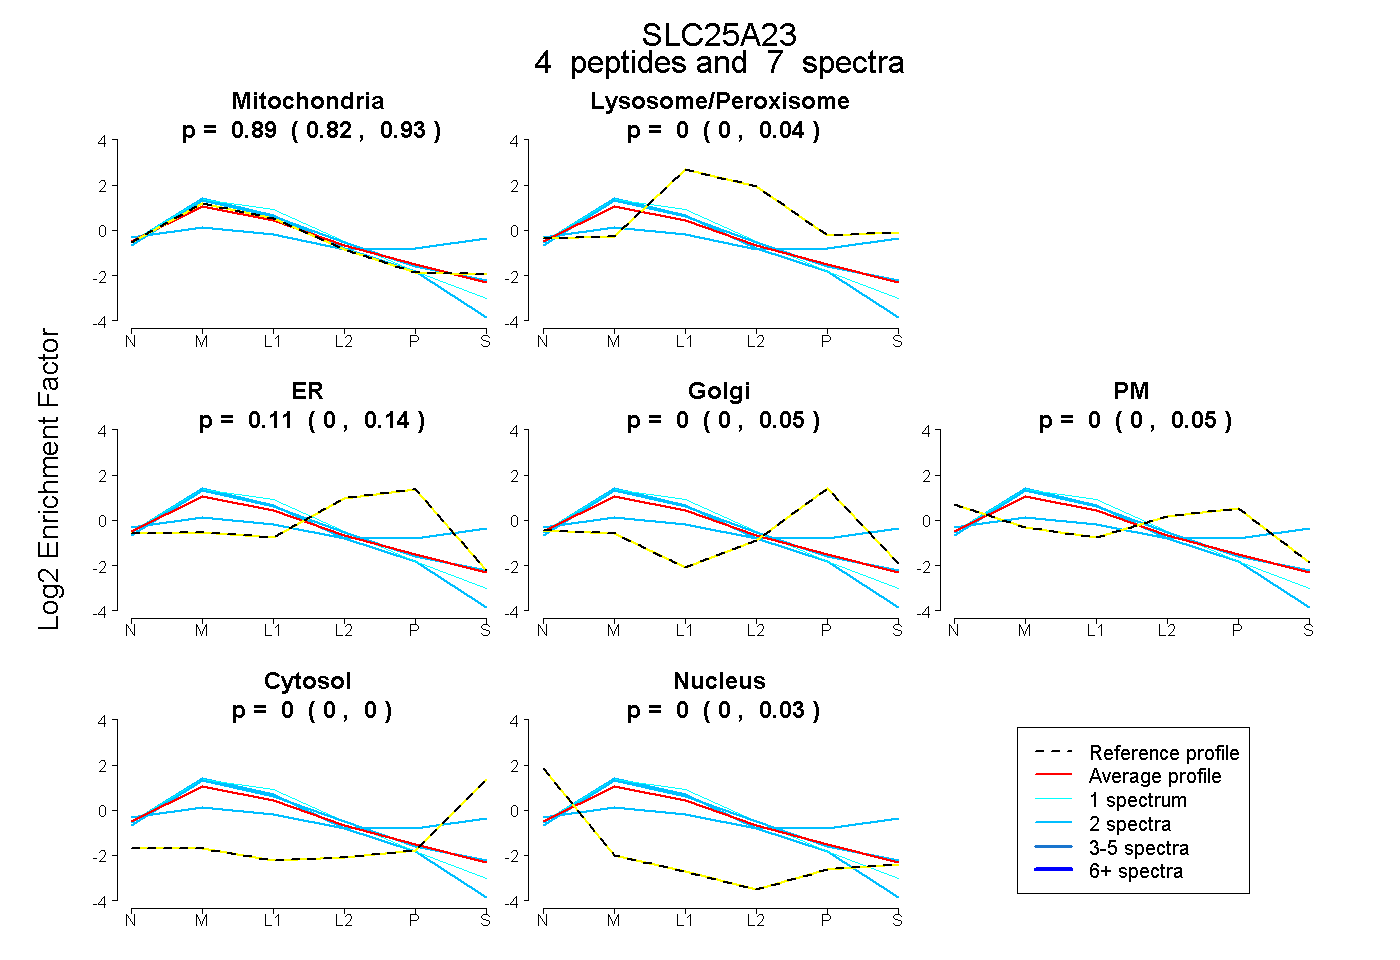 |
0.892 0.822 | 0.928 |
0.000 0.000 | 0.041 |
0.106 0.000 | 0.140 |
0.000 0.000 | 0.049 |
0.000 0.000 | 0.046 |
0.000 0.000 | 0.000 |
0.002 0.000 | 0.029 |
|||
| Plot | Lyso | Other | |||||||||||
| Expt C |
10 peptides |
42 spectra |
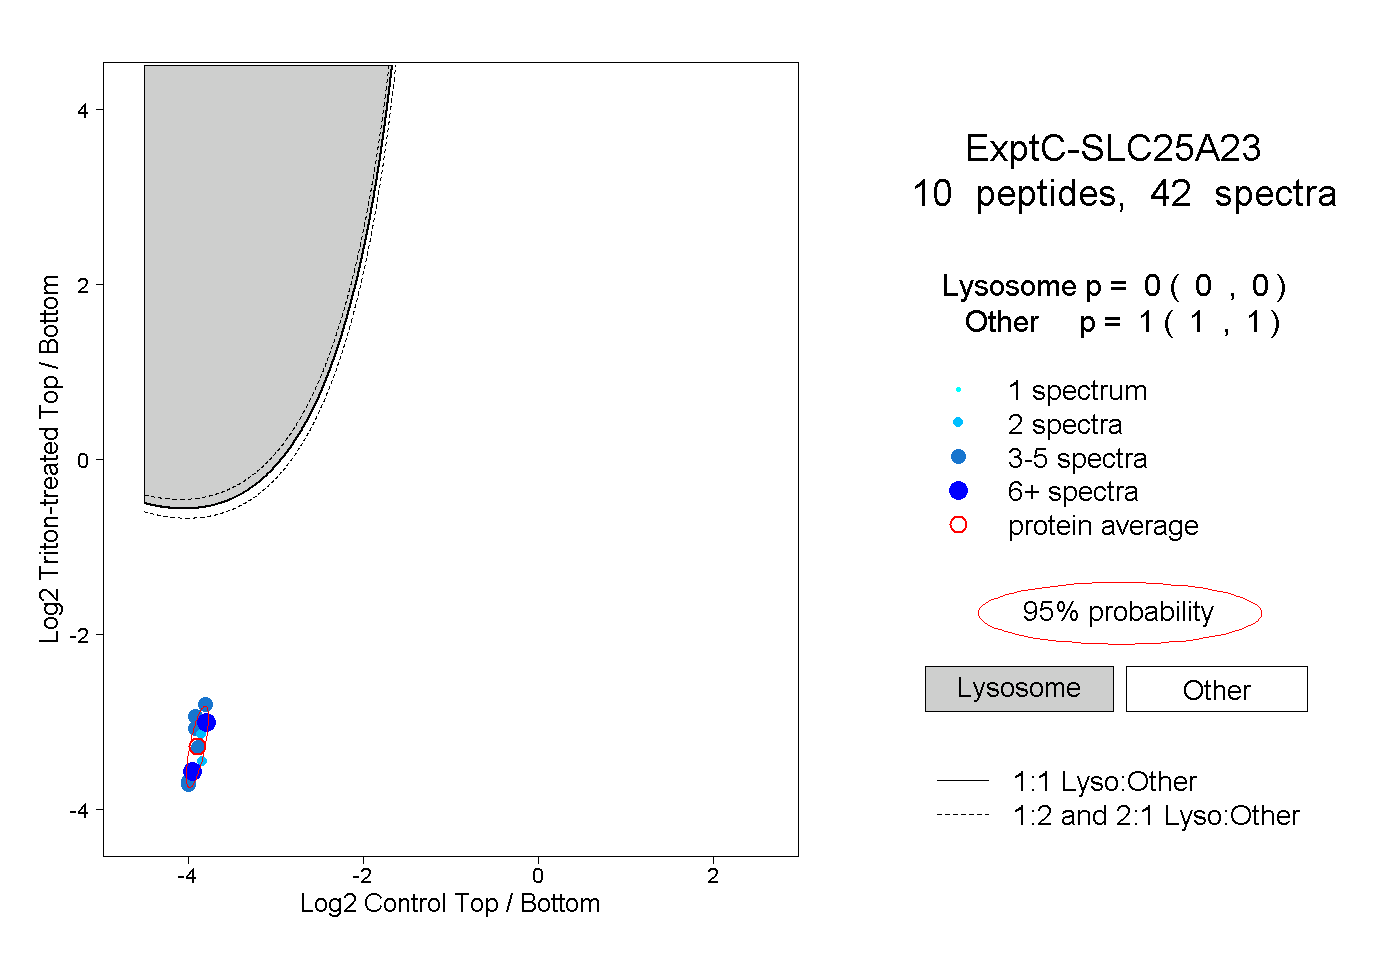 |
0.000 0.000 | 0.000 |
1.000 1.000 | 1.000 |
||||||||
| Plot | Lyso | Other | |||||||||||
| Expt D |
3 peptides |
5 spectra |
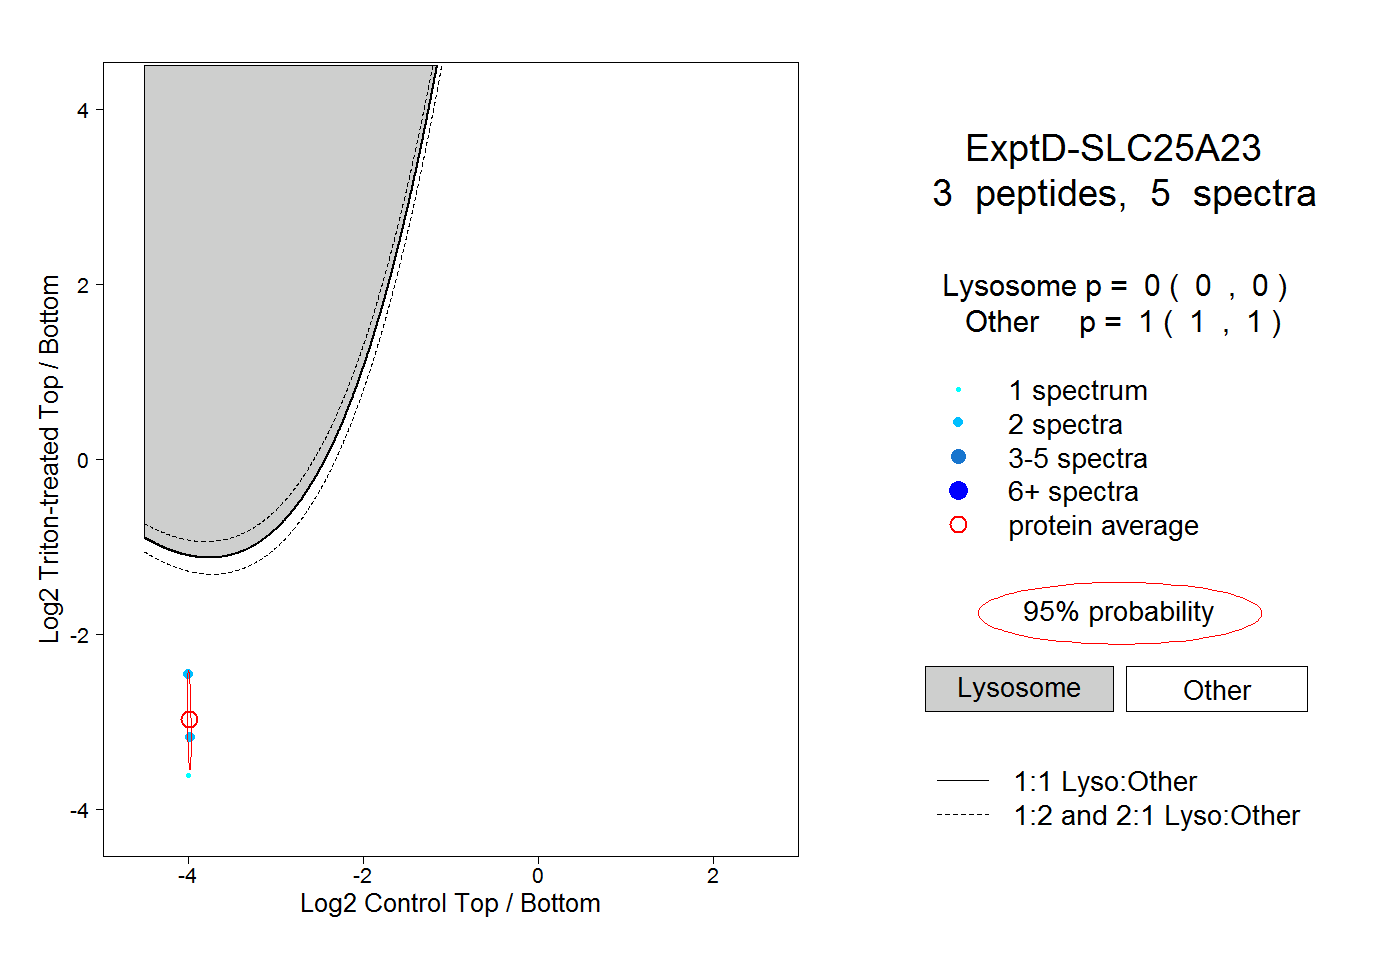 |
0.000 0.000 | 0.000 |
1.000 1.000 | 1.000 |