 5
5peptides
spectra
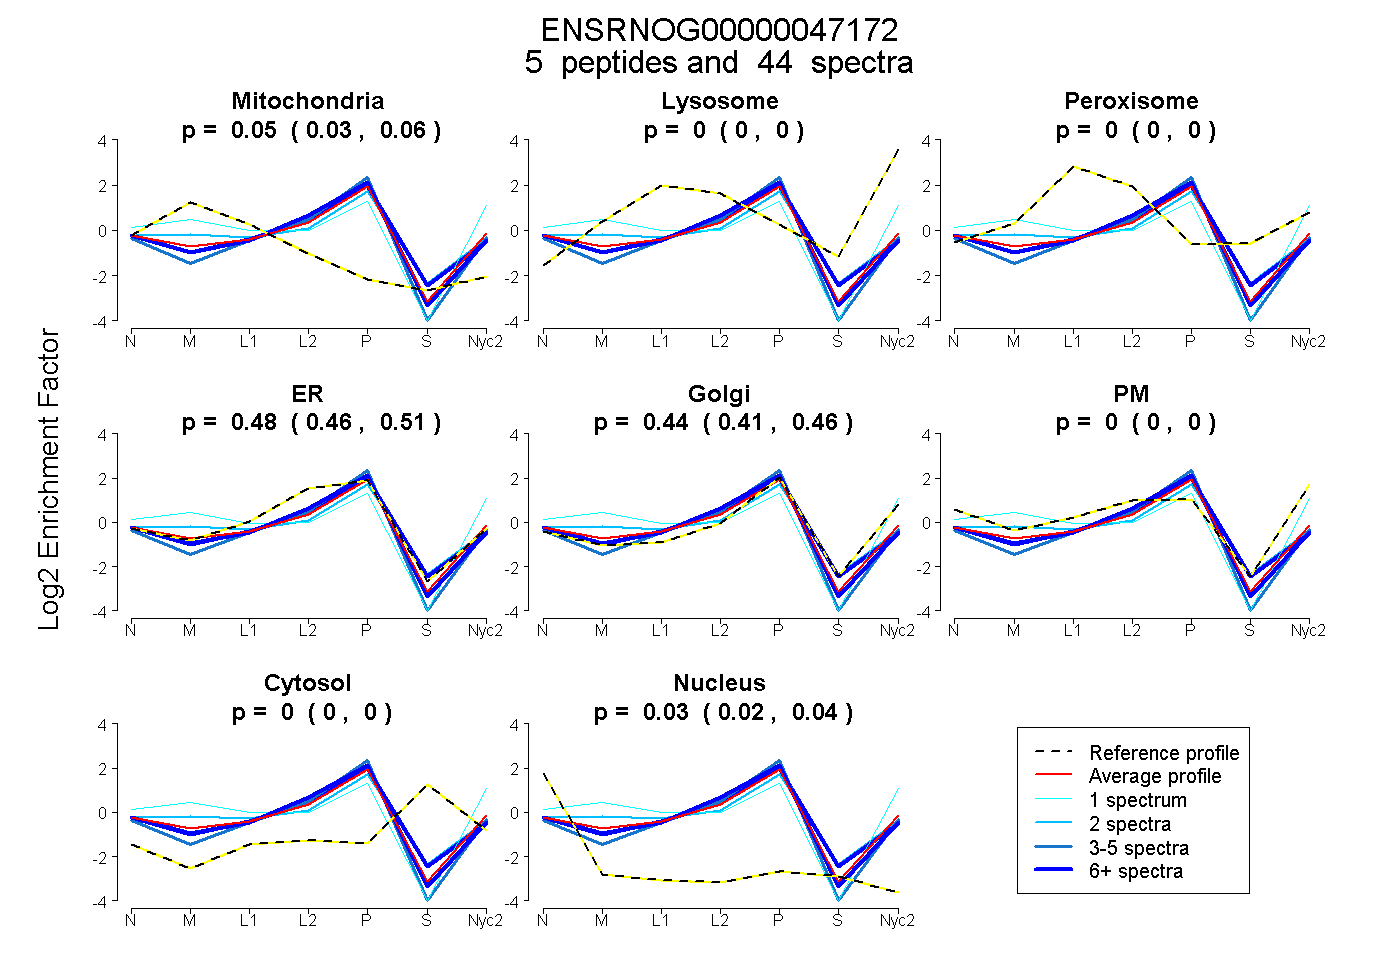
0.027 | 0.061
0.000 | 0.000
0.000 | 0.000
0.456 | 0.509
0.408 | 0.464
0.000 | 0.000
0.000 | 0.000
0.017 | 0.040
2peptides
spectra
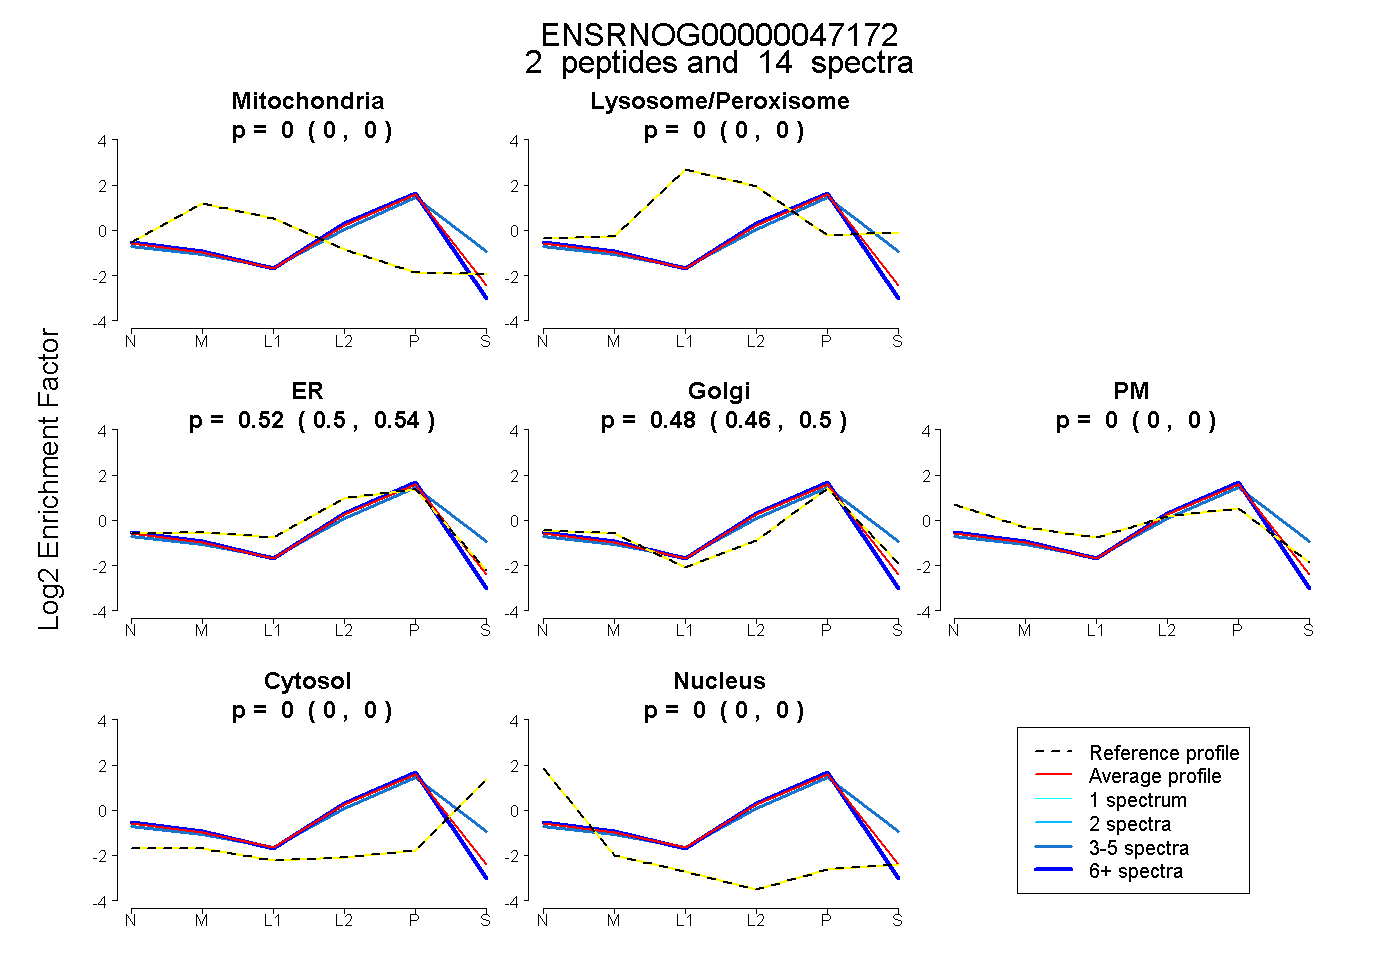
0.000 | 0.000
0.000 | 0.000
0.500 | 0.536
0.461 | 0.497
0.000 | 0.000
0.000 | 0.000
0.000 | 0.000
3peptides
spectra
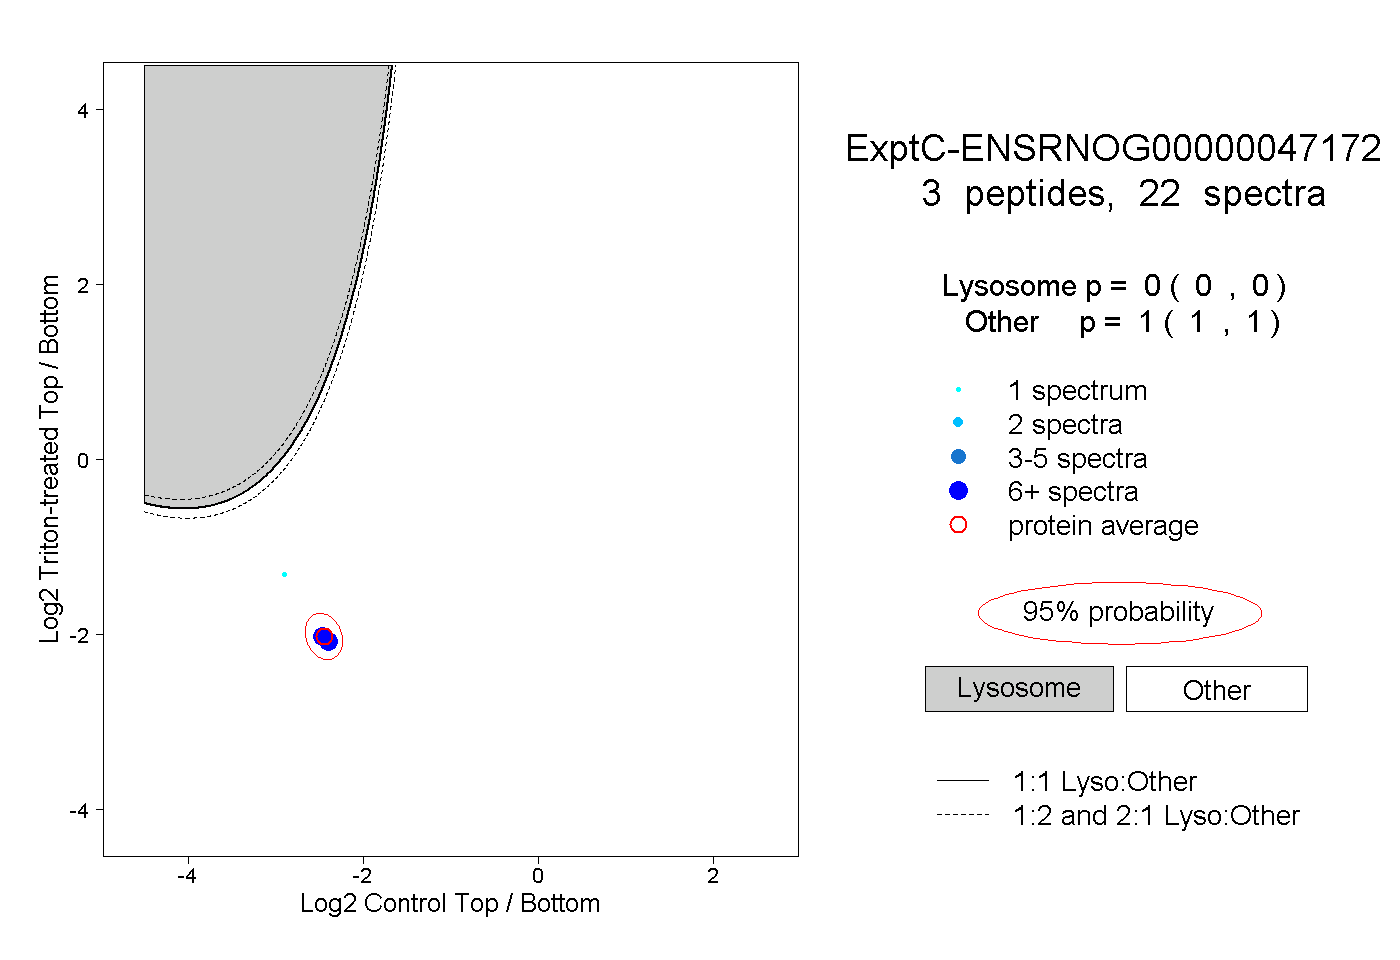
0.000 | 0.000
1.000 | 1.000
2peptides
spectra
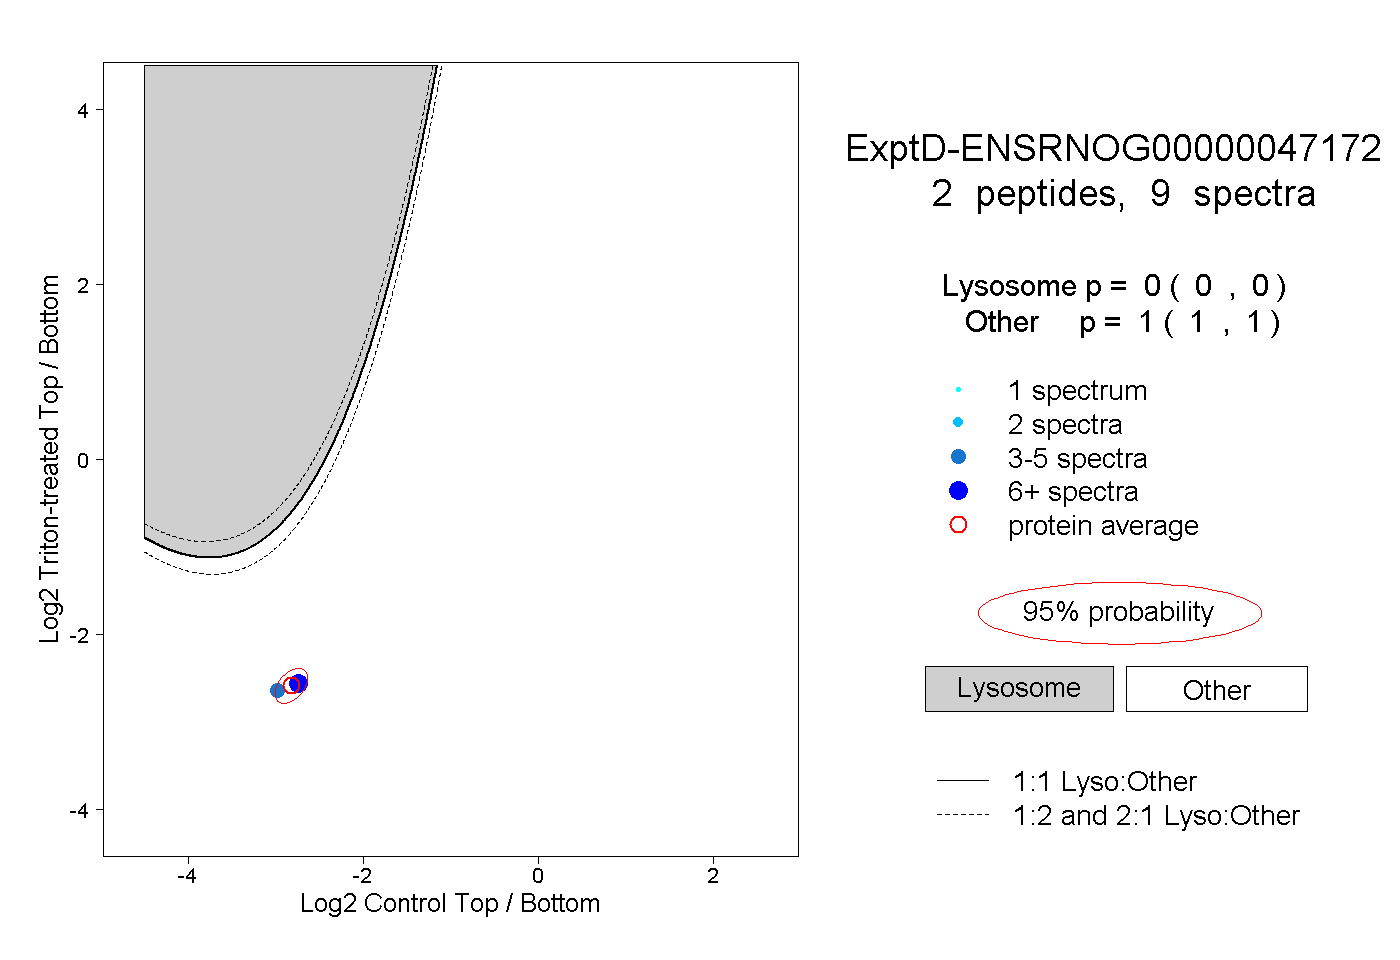
0.000 | 0.000
1.000 | 1.000