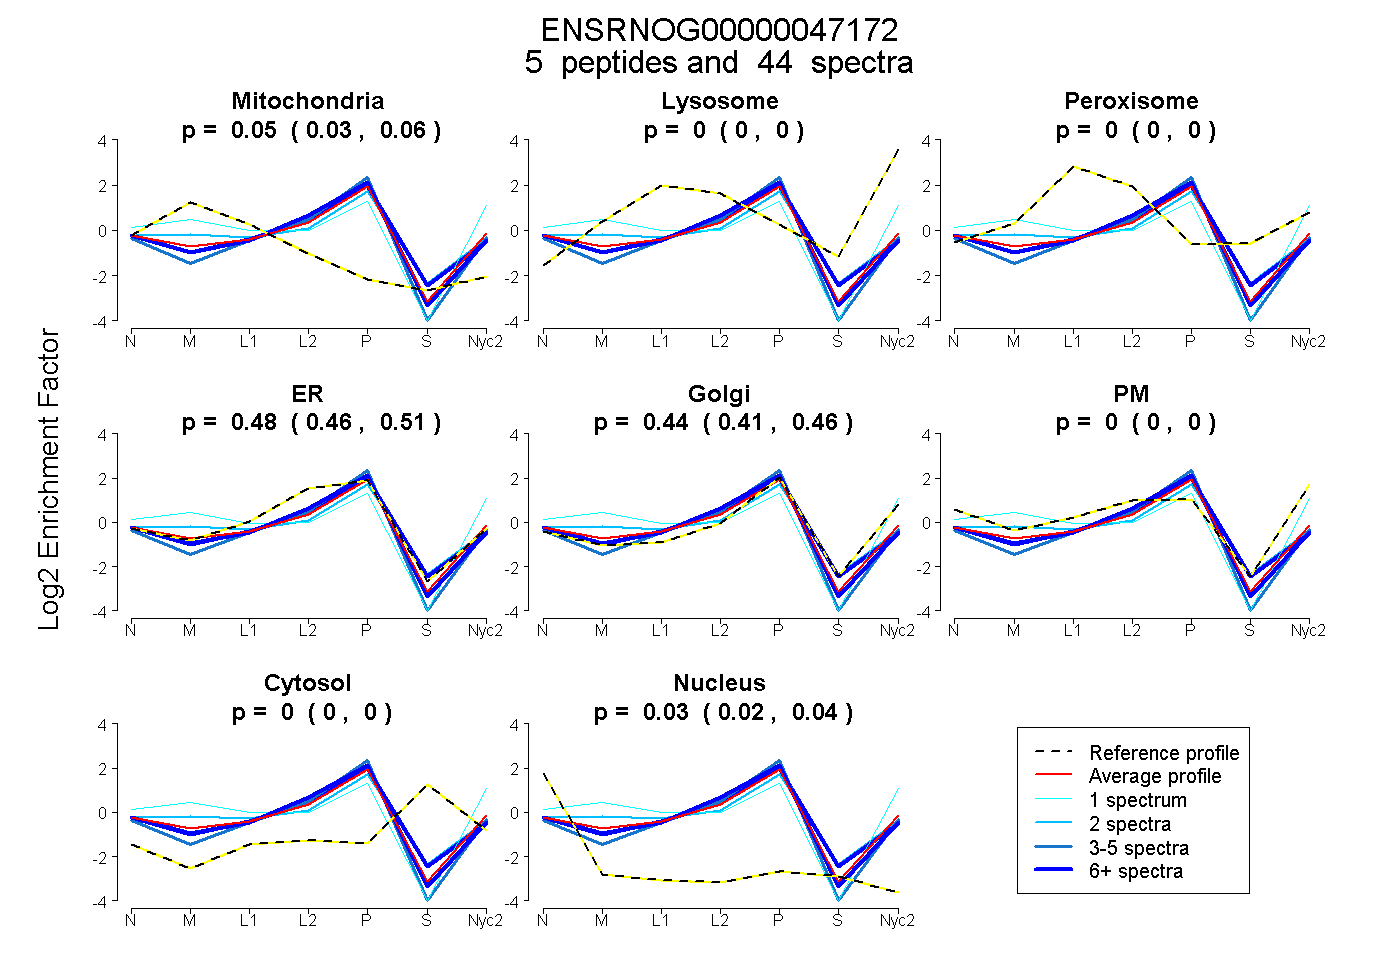
 5
5peptides
spectra
0.027 | 0.061
0.000 | 0.000
0.000 | 0.000
0.456 | 0.509
0.408 | 0.464
0.000 | 0.000
0.000 | 0.000
0.017 | 0.040
| Plot | Mito | Lyso | Perox | ER | Golgi | PM | Cytosol | Nucleus | |||||
| Expt A |
5 peptides |
44 spectra |
|
0.046 0.027 | 0.061 |
0.000 0.000 | 0.000 |
0.000 0.000 | 0.000 |
0.485 0.456 | 0.509 |
0.440 0.408 | 0.464 |
0.000 0.000 | 0.000 |
0.000 0.000 | 0.000 |
0.030 0.017 | 0.040 |
| 2 spectra, DWILQGCYGK | 0.177 | 0.000 | 0.000 | 0.333 | 0.490 | 0.000 | 0.000 | 0.000 | ||
| 24 spectra, GFVGALR | 0.000 | 0.000 | 0.000 | 0.592 | 0.331 | 0.000 | 0.005 | 0.073 | ||
| 1 spectrum, LSTICPGHVHSNIFQNFITGEFTK | 0.156 | 0.000 | 0.000 | 0.000 | 0.292 | 0.551 | 0.000 | 0.000 | ||
| 12 spectra, TELFDYPGIR | 0.000 | 0.000 | 0.000 | 0.678 | 0.263 | 0.000 | 0.000 | 0.059 | ||
| 5 spectra, LPEIPLFMMETSR | 0.000 | 0.000 | 0.000 | 0.591 | 0.357 | 0.000 | 0.000 | 0.052 |
| Plot | Mito | Lyso or Perox | ER | Golgi | PM | Cytosol | Nucleus | ||||||
| Expt B |
2 peptides |
14 spectra |
 |
0.000 0.000 | 0.000 |
0.000 0.000 | 0.000 |
0.520 0.500 | 0.536 |
0.480 0.461 | 0.497 |
0.000 0.000 | 0.000 |
0.000 0.000 | 0.000 |
0.000 0.000 | 0.000 |
|||
| Plot | Lyso | Other | |||||||||||
| Expt C |
3 peptides |
22 spectra |
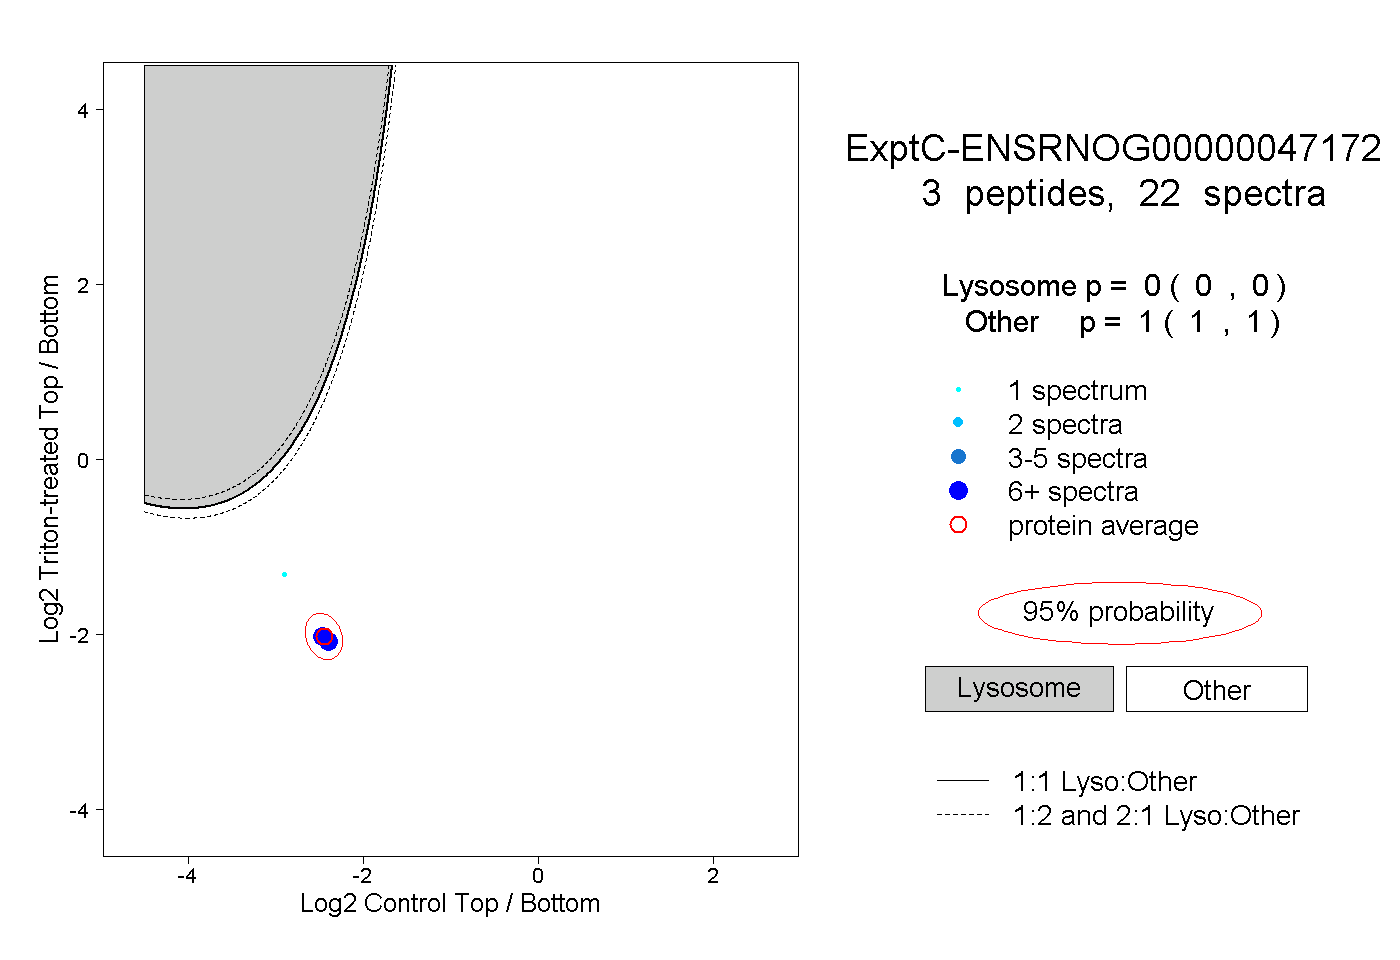 |
0.000 0.000 | 0.000 |
1.000 1.000 | 1.000 |
||||||||
| Plot | Lyso | Other | |||||||||||
| Expt D |
2 peptides |
9 spectra |
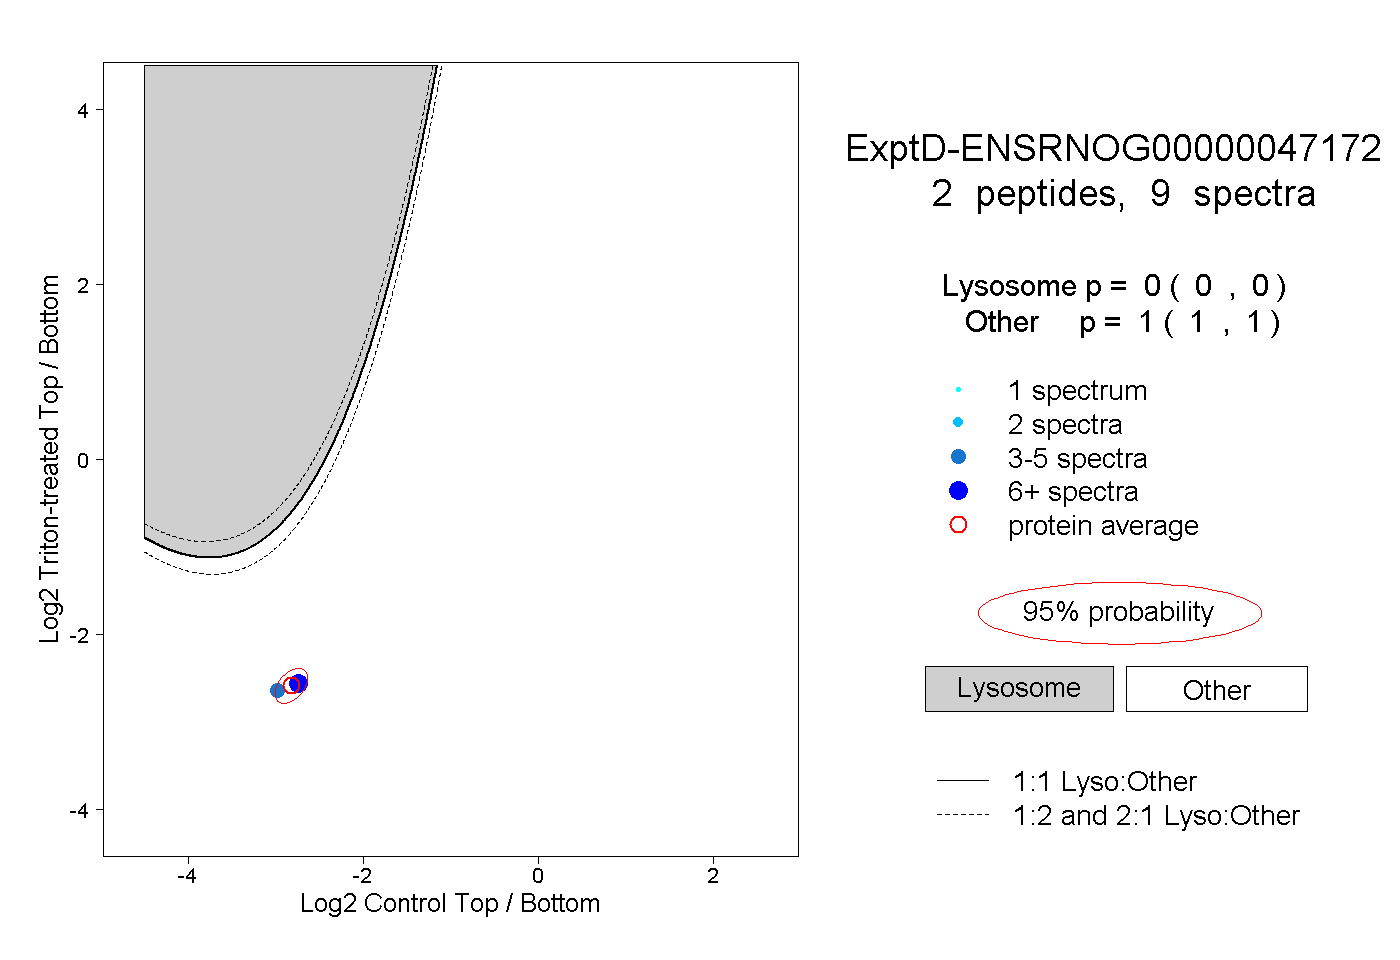 |
0.000 0.000 | 0.000 |
1.000 1.000 | 1.000 |