 4
4peptides
spectra
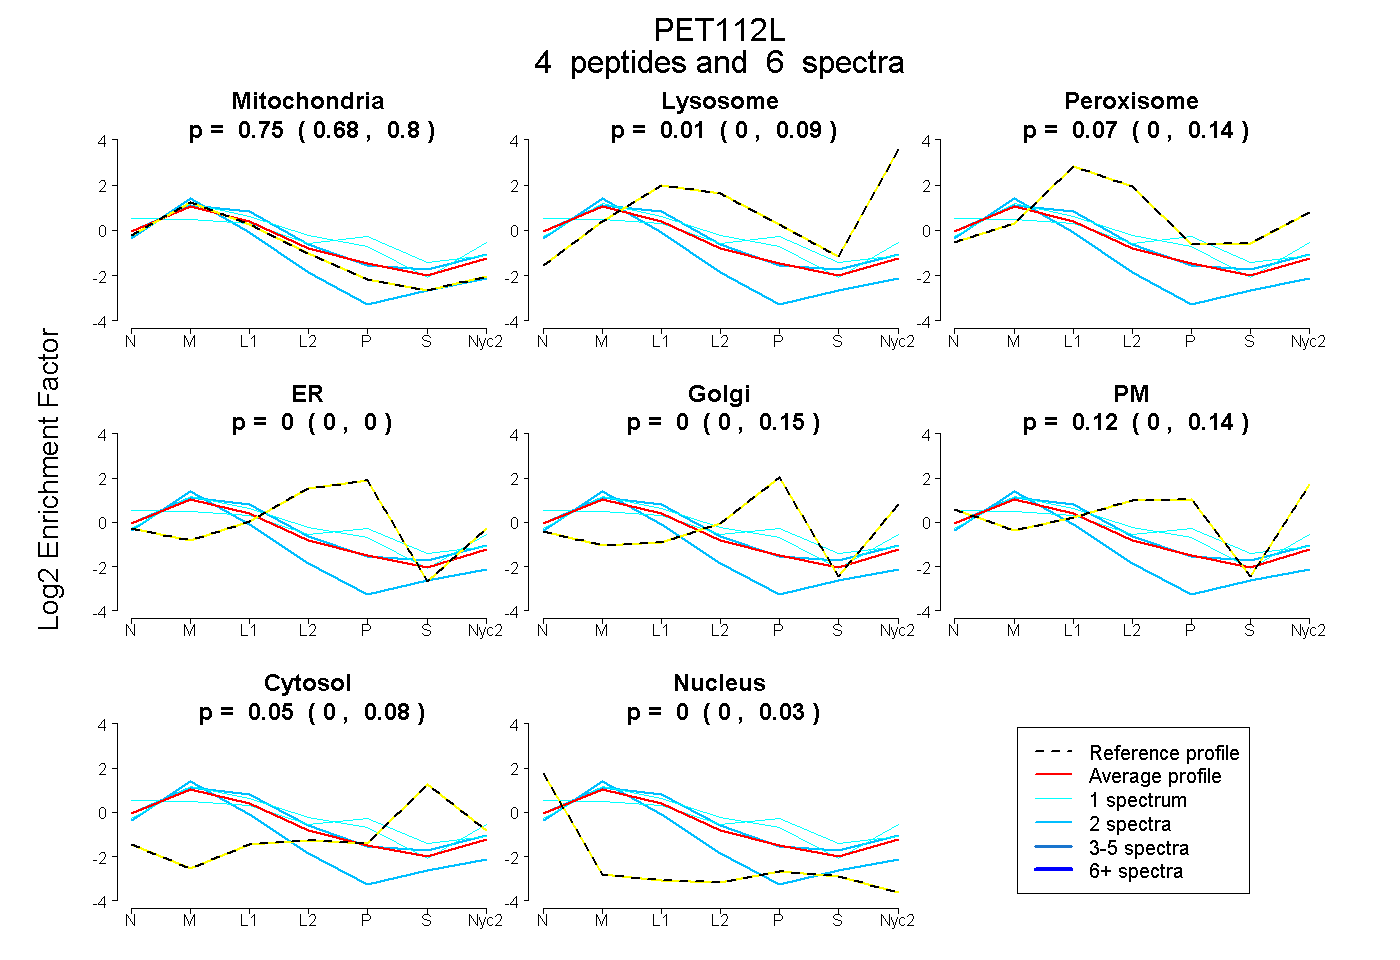
0.683 | 0.805
0.000 | 0.092
0.000 | 0.136
0.000 | 0.000
0.000 | 0.150
0.000 | 0.143
0.000 | 0.076
0.000 | 0.026
7peptides
spectra
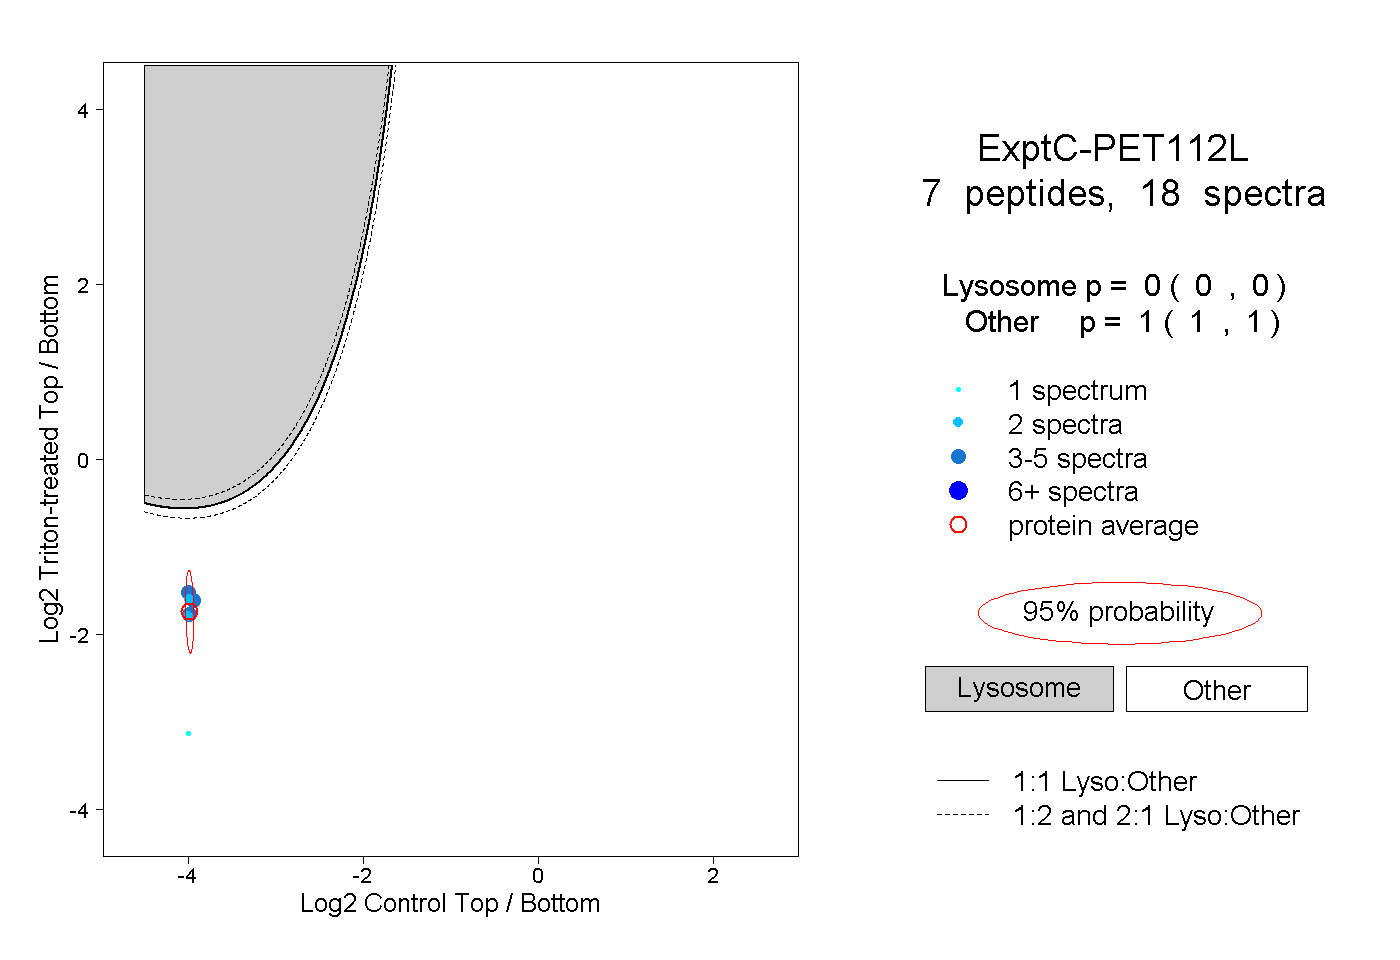
0.000 | 0.000
1.000 | 1.000
1peptide
spectra
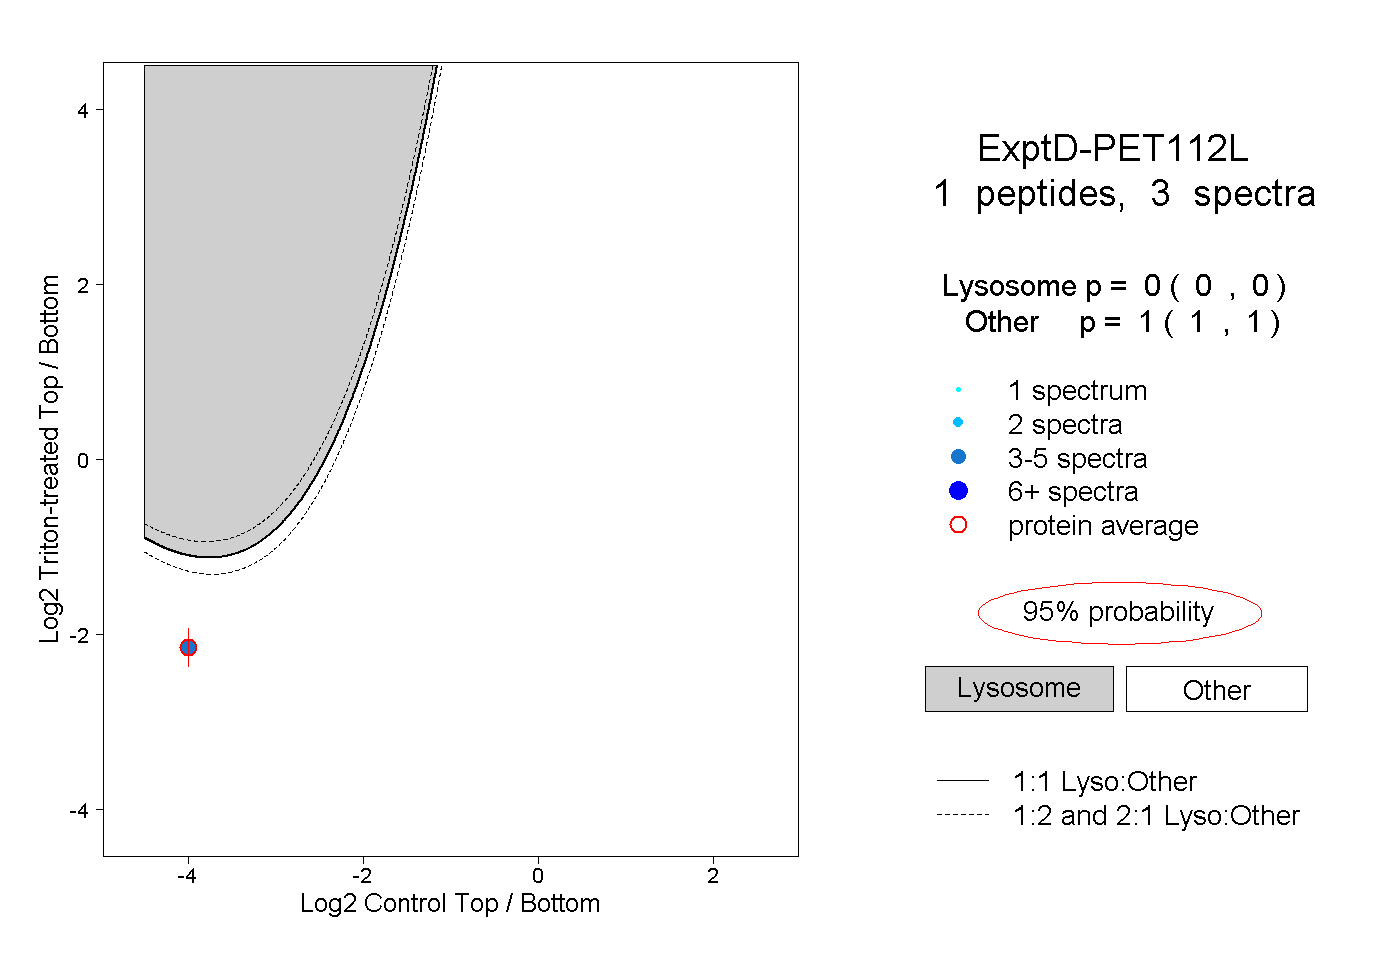
0.000 | 0.000
1.000 | 1.000