 4
4peptides
spectra
0.683 | 0.805
0.000 | 0.092
0.000 | 0.136
0.000 | 0.000
0.000 | 0.150
0.000 | 0.143
0.000 | 0.076
0.000 | 0.026
7peptides
spectra
0.000 | 0.000
1.000 | 1.000
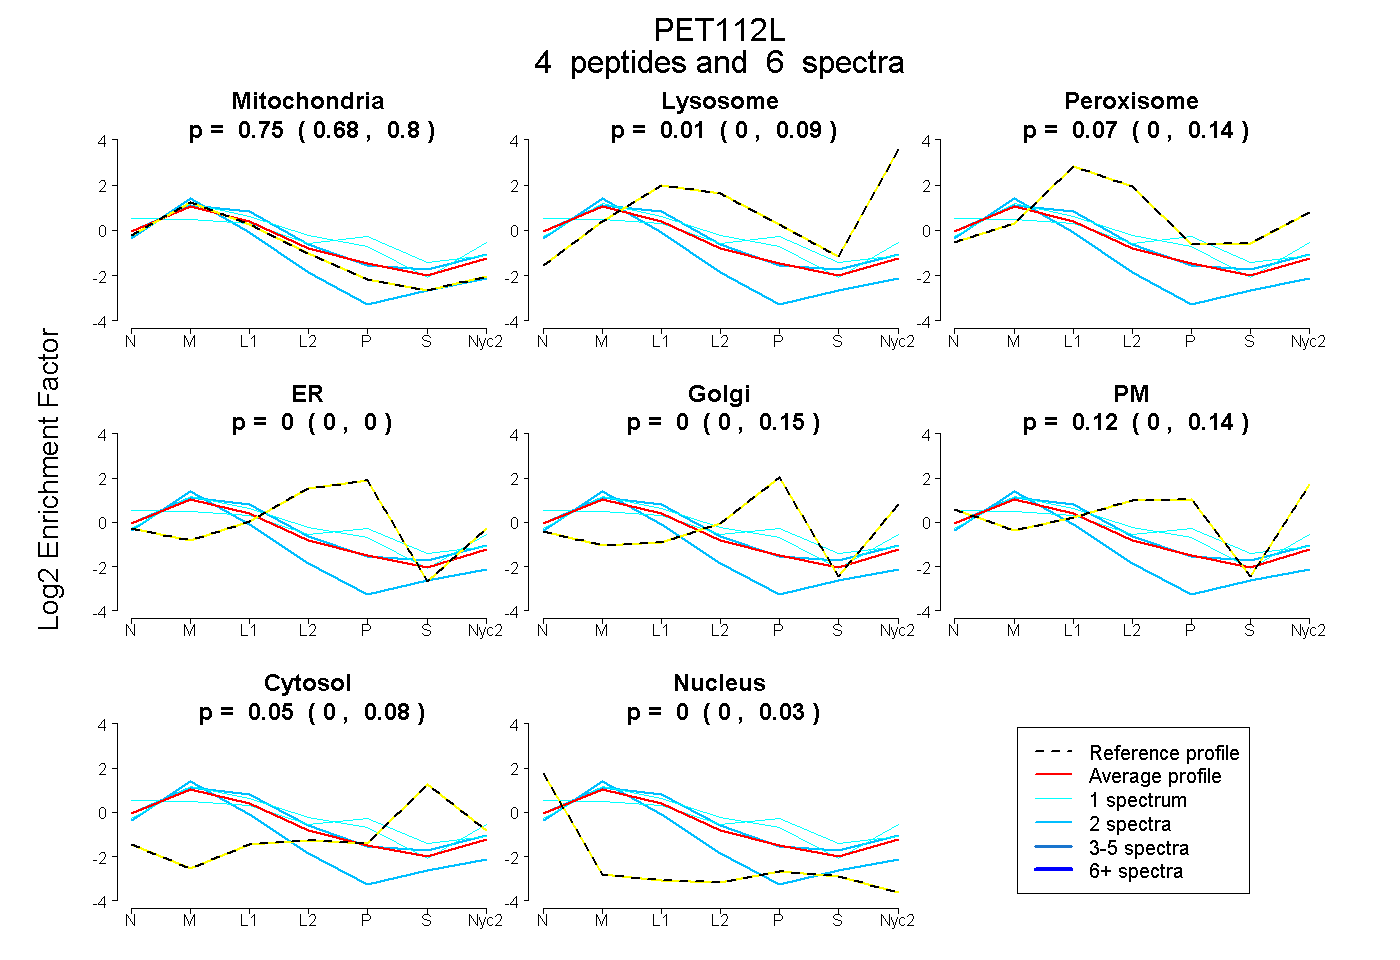
| Plot | Mito | Lyso | Perox | ER | Golgi | PM | Cytosol | Nucleus | |||||
| Expt A |
4 peptides |
6 spectra |
|
0.752 0.683 | 0.805 |
0.008 0.000 | 0.092 |
0.073 0.000 | 0.136 |
0.000 0.000 | 0.000 |
0.000 0.000 | 0.150 |
0.117 0.000 | 0.143 |
0.050 0.000 | 0.076 |
0.000 0.000 | 0.026 |
||
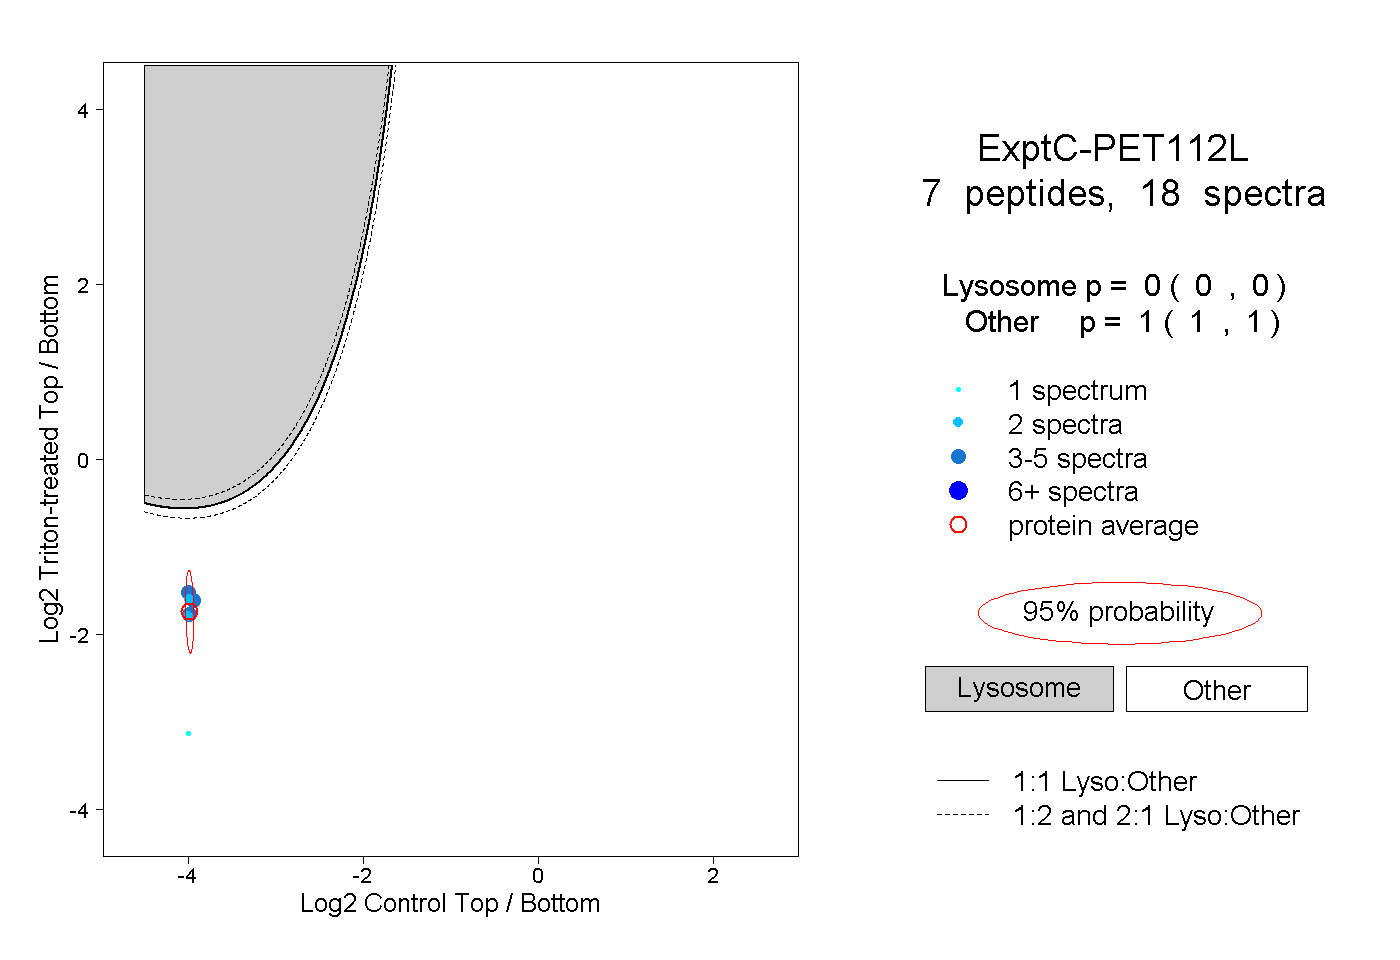
| Plot | Lyso | Other | |||||||||||
| Expt C |
7 peptides |
18 spectra |
|
0.000 0.000 | 0.000 |
1.000 1.000 | 1.000 |
| 2 spectra, SQTLIDLNR | 0.000 | 1.000 | ||||||||
| 1 spectrum, SFDYK | 0.000 | 1.000 | ||||||||
| 2 spectra, QVFEELWR | 0.000 | 1.000 | ||||||||
| 4 spectra, ADPALIK | 0.000 | 1.000 | ||||||||
| 3 spectra, HSQVTTK | 0.000 | 1.000 | ||||||||
| 5 spectra, AIDYEIQR | 0.000 | 1.000 | ||||||||
| 1 spectrum, NLNSLR | 0.000 | 1.000 |
| Plot | Lyso | Other | |||||||||||
| Expt D |
1 peptide |
3 spectra |
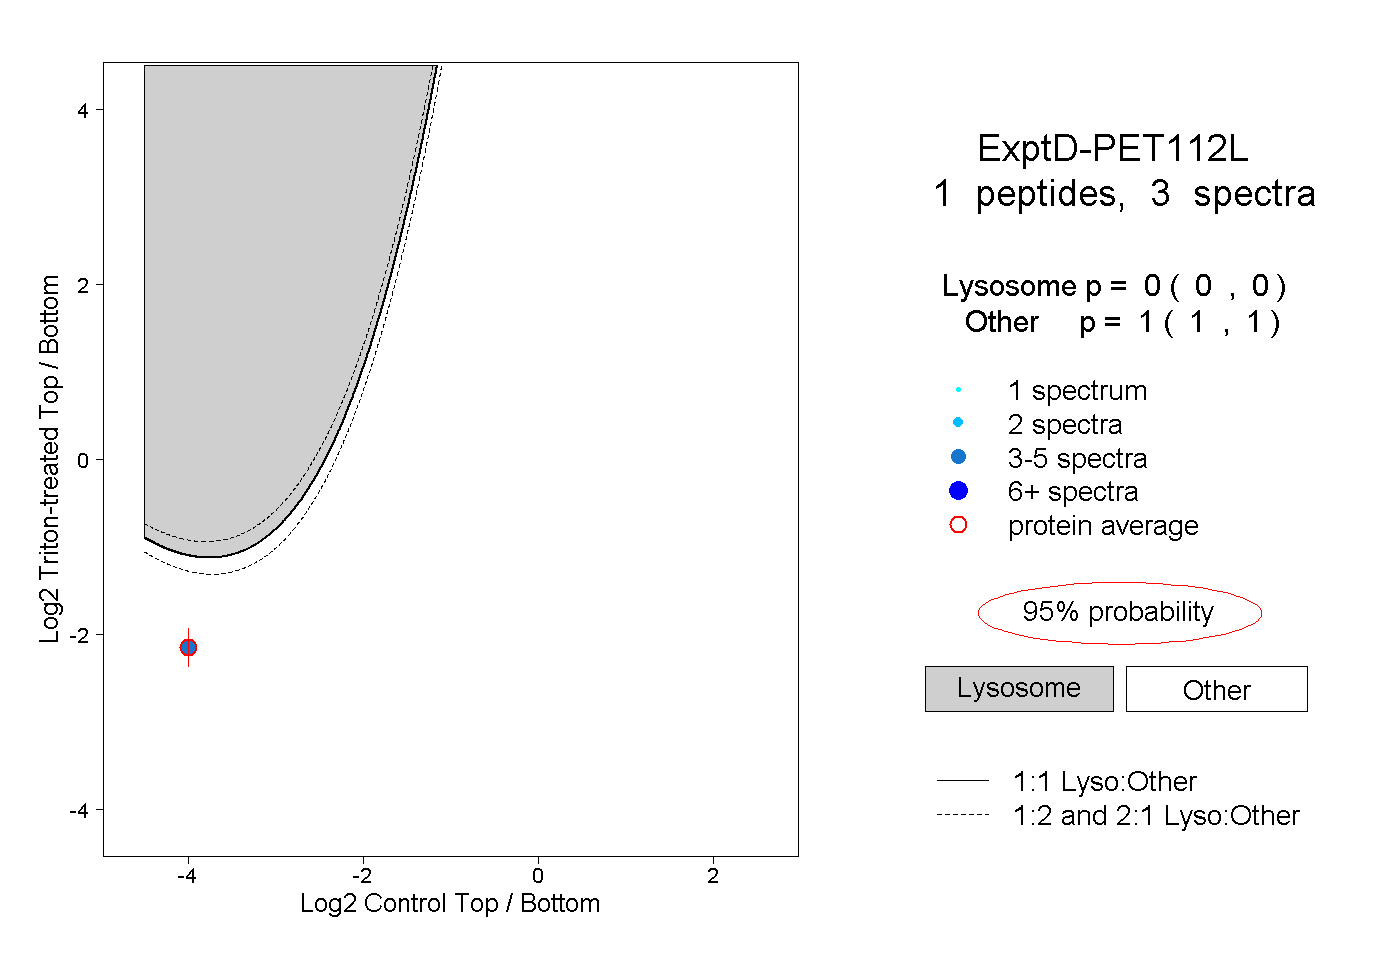 |
0.000 0.000 | 0.000 |
1.000 1.000 | 1.000 |