 3
3peptides
spectra
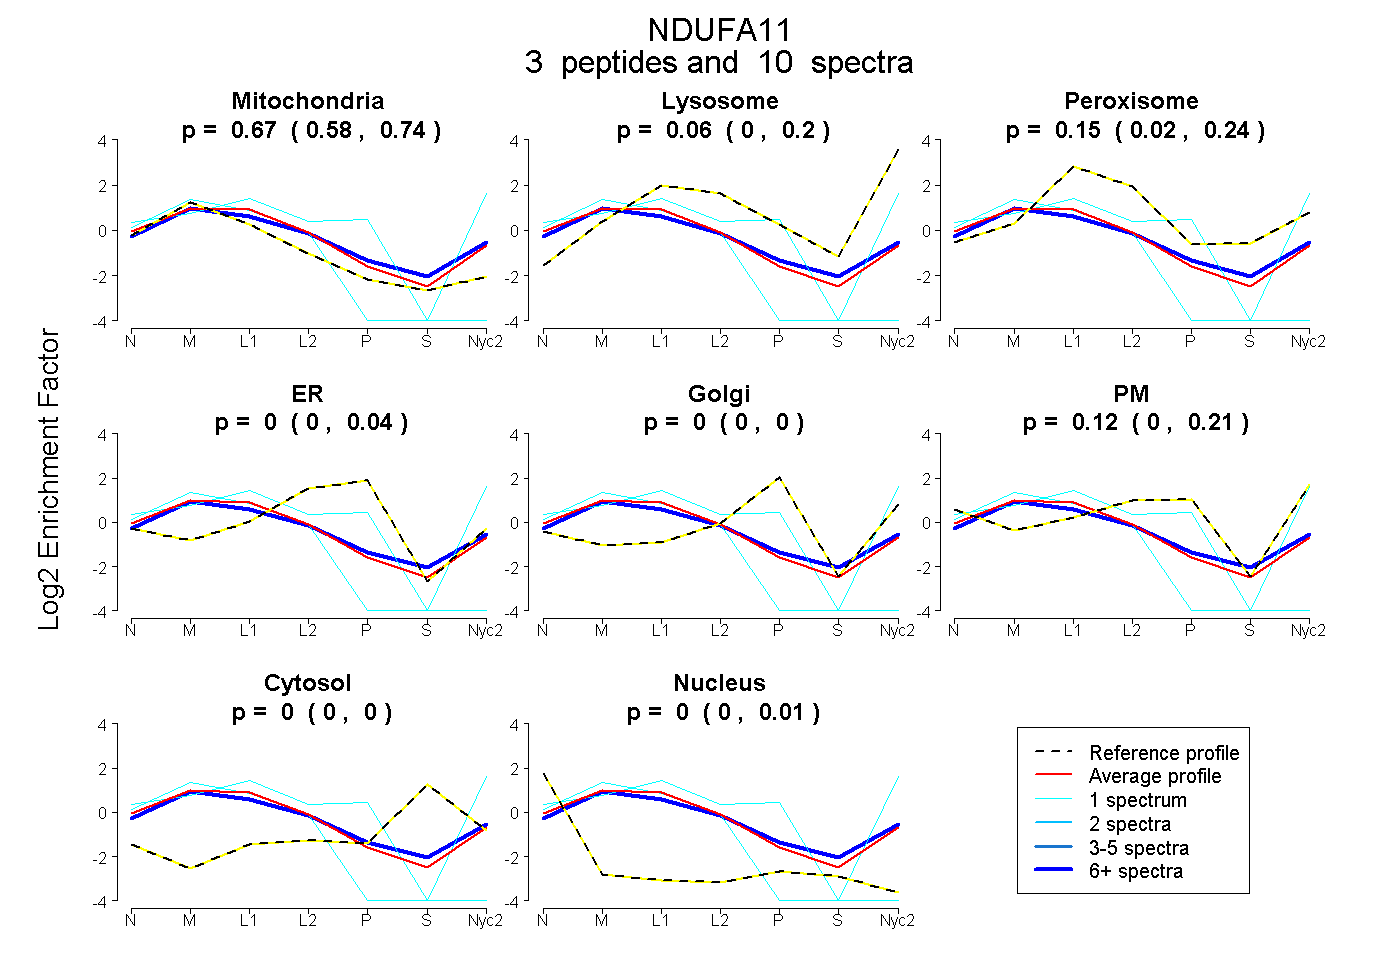
0.576 | 0.736
0.000 | 0.196
0.024 | 0.236
0.000 | 0.041
0.000 | 0.000
0.000 | 0.210
0.000 | 0.000
0.000 | 0.008
1peptide
spectrum
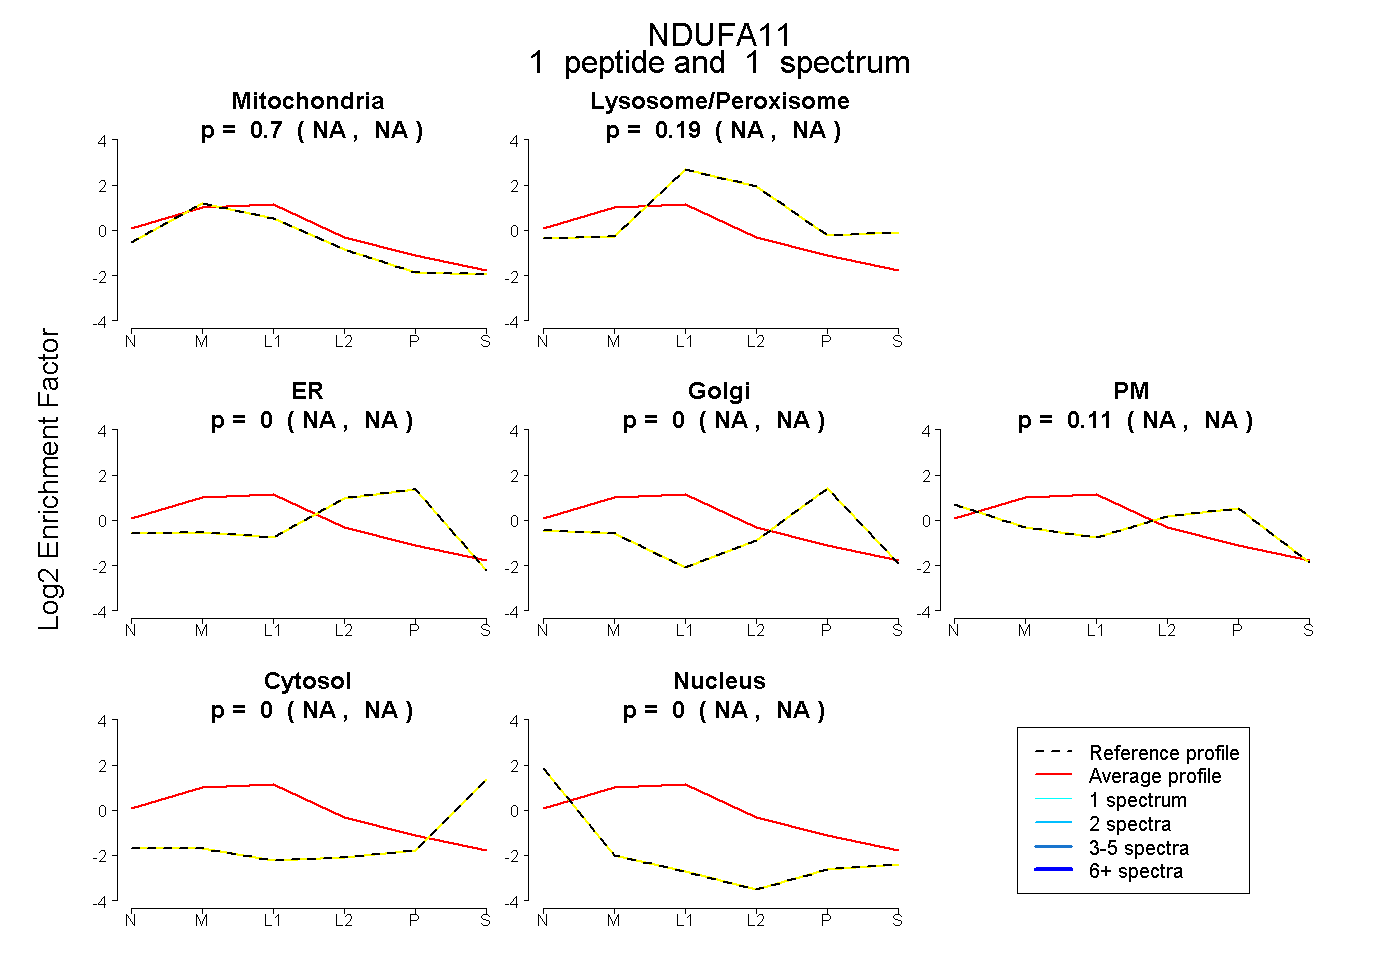
NA | NA
NA | NA
NA | NA
NA | NA
NA | NA
NA | NA
NA | NA
4peptides
spectra
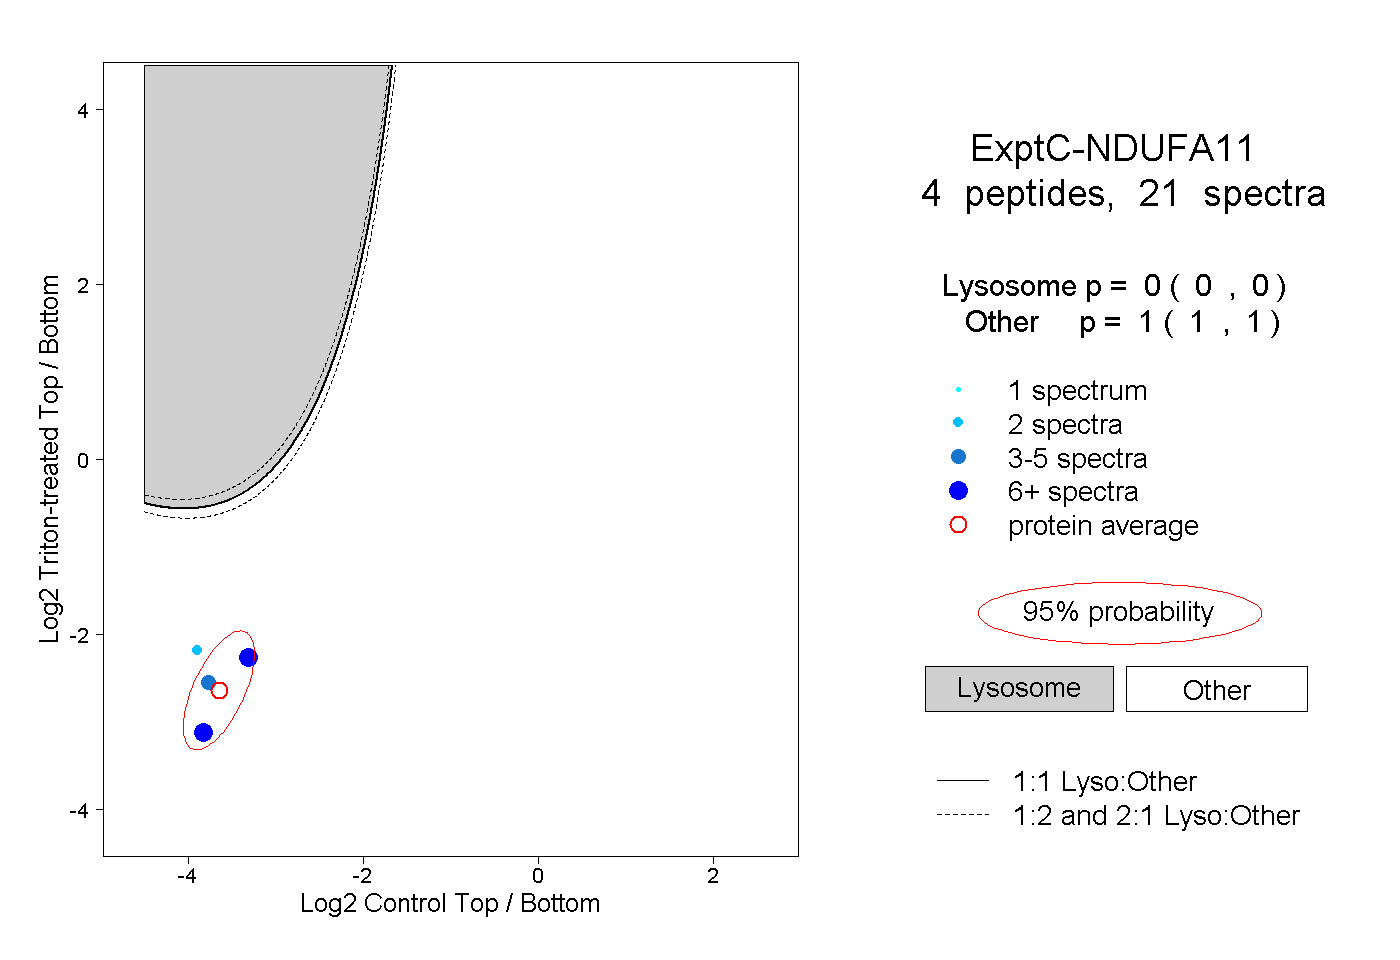
0.000 | 0.000
1.000 | 1.000