 3
3peptides
spectra
0.576 | 0.736
0.000 | 0.196
0.024 | 0.236
0.000 | 0.041
0.000 | 0.000
0.000 | 0.210
0.000 | 0.000
0.000 | 0.008
| Plot | Mito | Lyso | Perox | ER | Golgi | PM | Cytosol | Nucleus | |||||
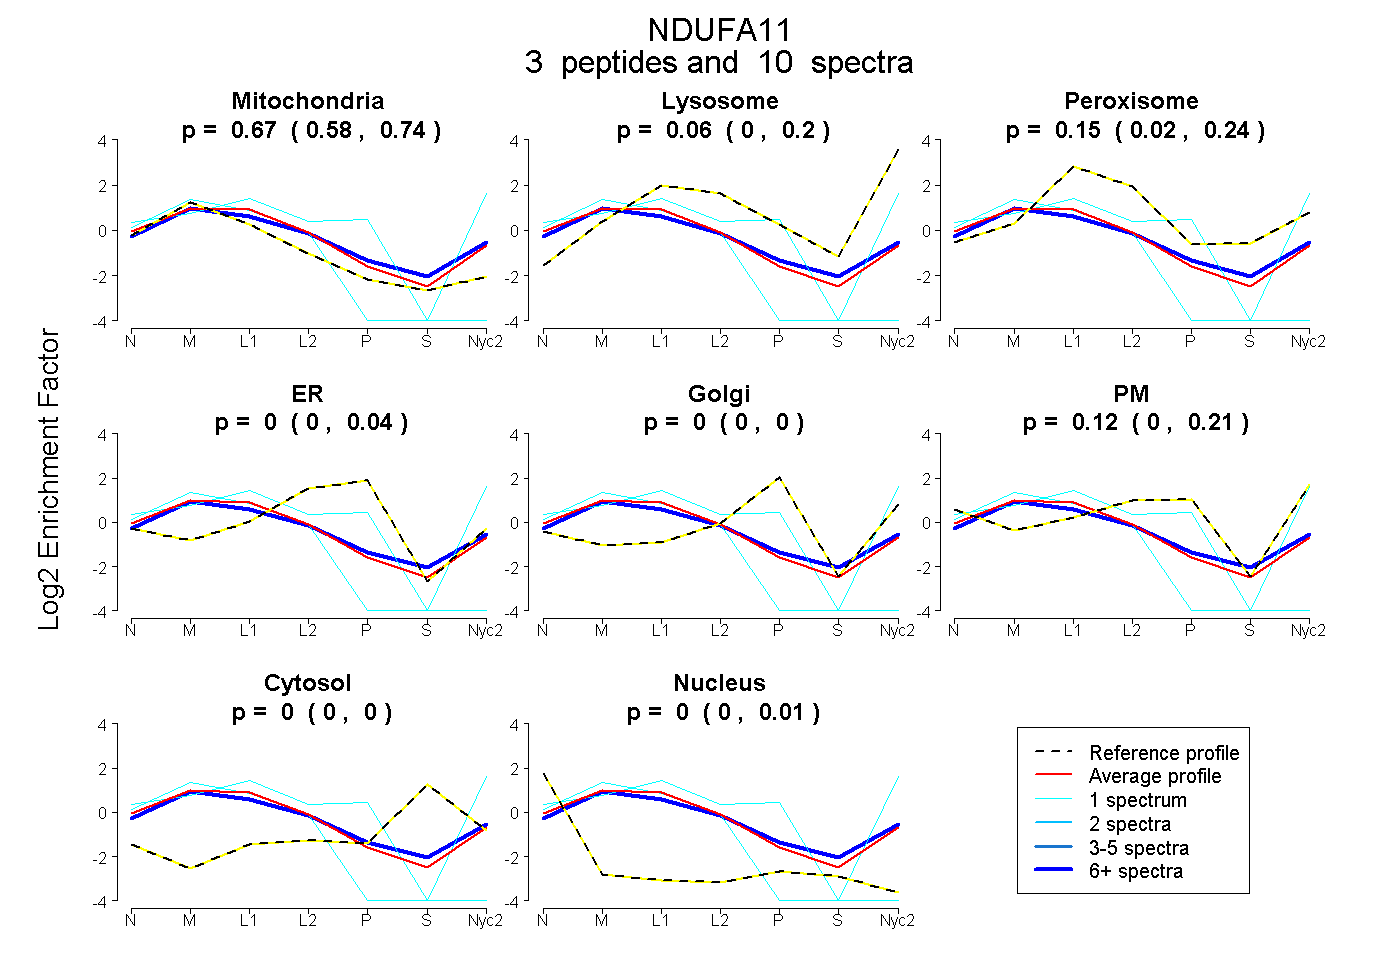
| Expt A |
3 peptides |
10 spectra |
|
0.665 0.576 | 0.736 |
0.063 0.000 | 0.196 |
0.154 0.024 | 0.236 |
0.000 0.000 | 0.041 |
0.000 0.000 | 0.000 |
0.118 0.000 | 0.210 |
0.000 0.000 | 0.000 |
0.000 0.000 | 0.008 |
| 8 spectra, FFEAYNETPDGTQCHR | 0.646 | 0.138 | 0.091 | 0.000 | 0.000 | 0.111 | 0.015 | 0.000 | ||
| 1 spectrum, THSYGTAAIGCVYMGTAAALFK | 0.196 | 0.136 | 0.000 | 0.000 | 0.000 | 0.668 | 0.000 | 0.000 | ||
| 1 spectrum, LEGWELFATPK | 0.987 | 0.000 | 0.000 | 0.000 | 0.000 | 0.000 | 0.000 | 0.013 |
| Plot | Mito | Lyso or Perox | ER | Golgi | PM | Cytosol | Nucleus | ||||||
| Expt B |
1 peptide |
1 spectrum |
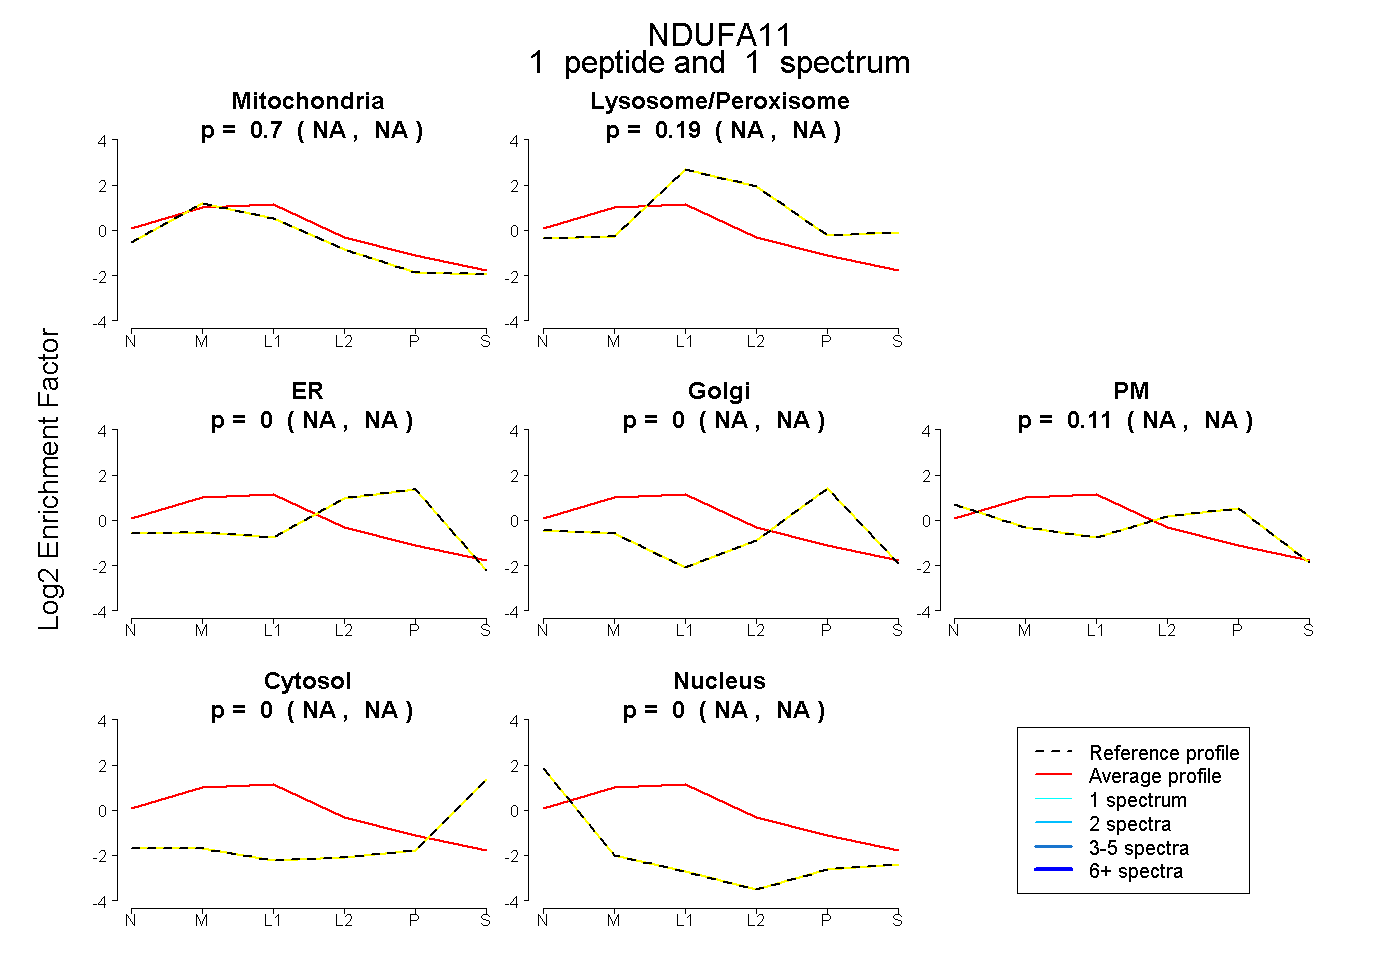 |
0.701 NA | NA |
0.186 NA | NA |
0.000 NA | NA |
0.000 NA | NA |
0.113 NA | NA |
0.000 NA | NA |
0.000 NA | NA |
|||
| Plot | Lyso | Other | |||||||||||
| Expt C |
4 peptides |
21 spectra |
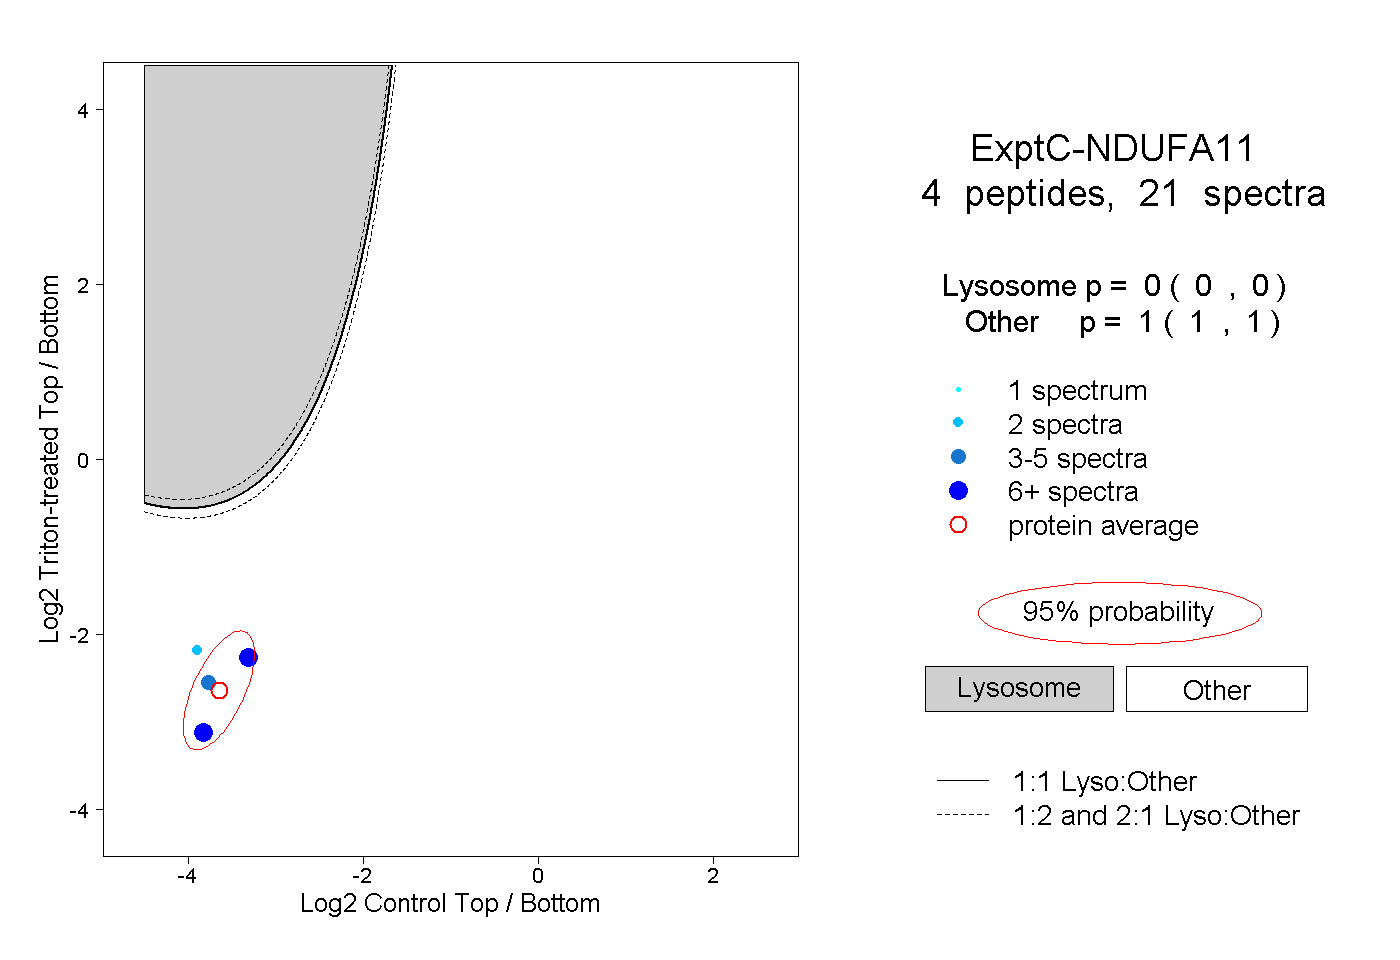 |
0.000 0.000 | 0.000 |
1.000 1.000 | 1.000 |