 5
5peptides
spectra
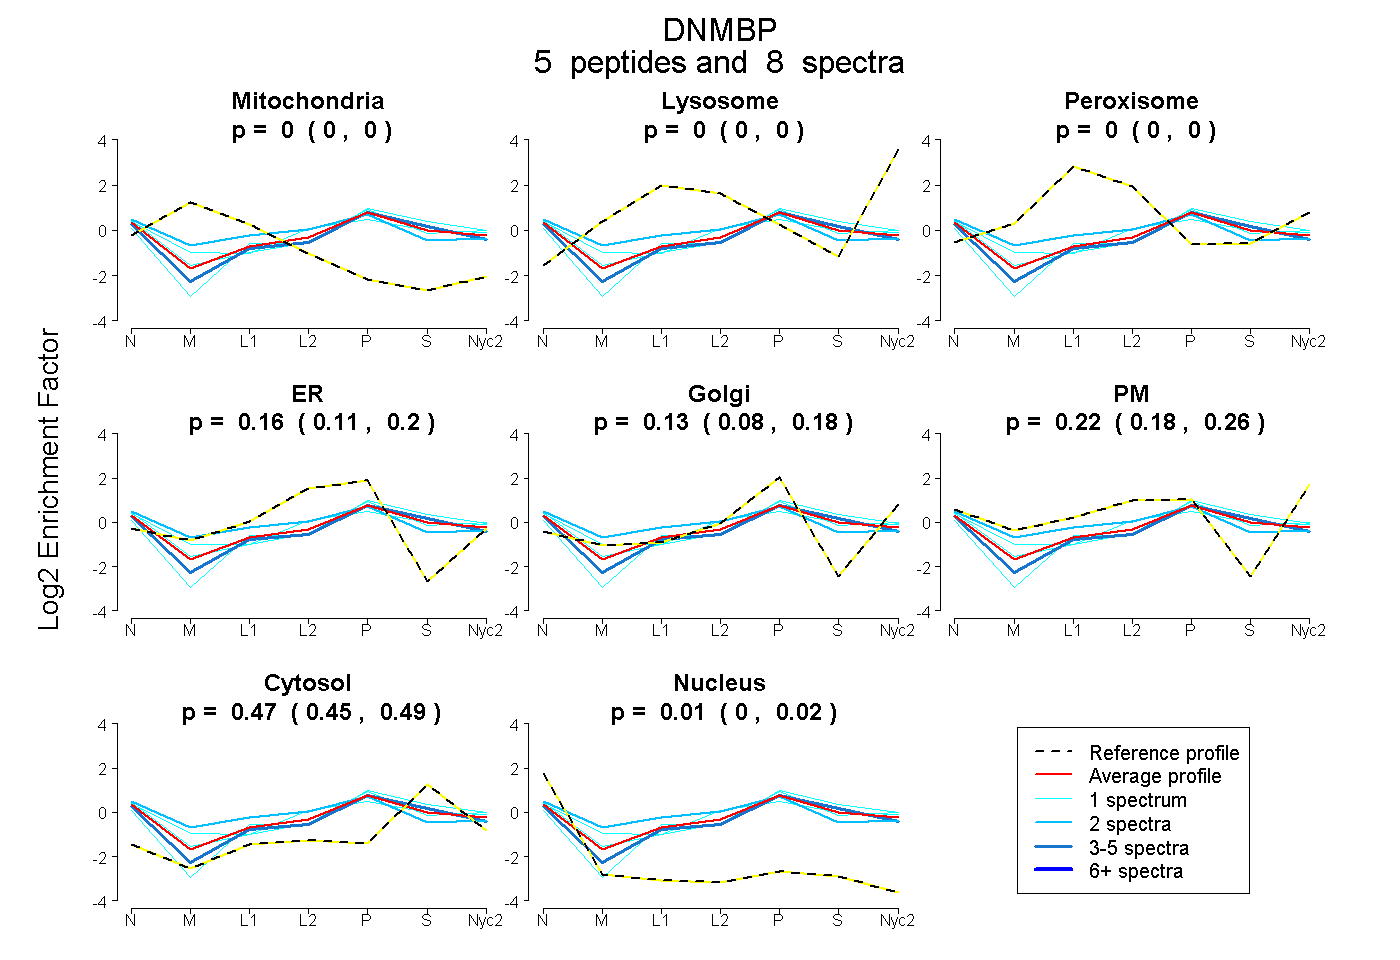
0.000 | 0.000
0.000 | 0.000
0.000 | 0.000
0.110 | 0.196
0.079 | 0.179
0.180 | 0.260
0.450 | 0.492
0.000 | 0.024
2peptides
spectra
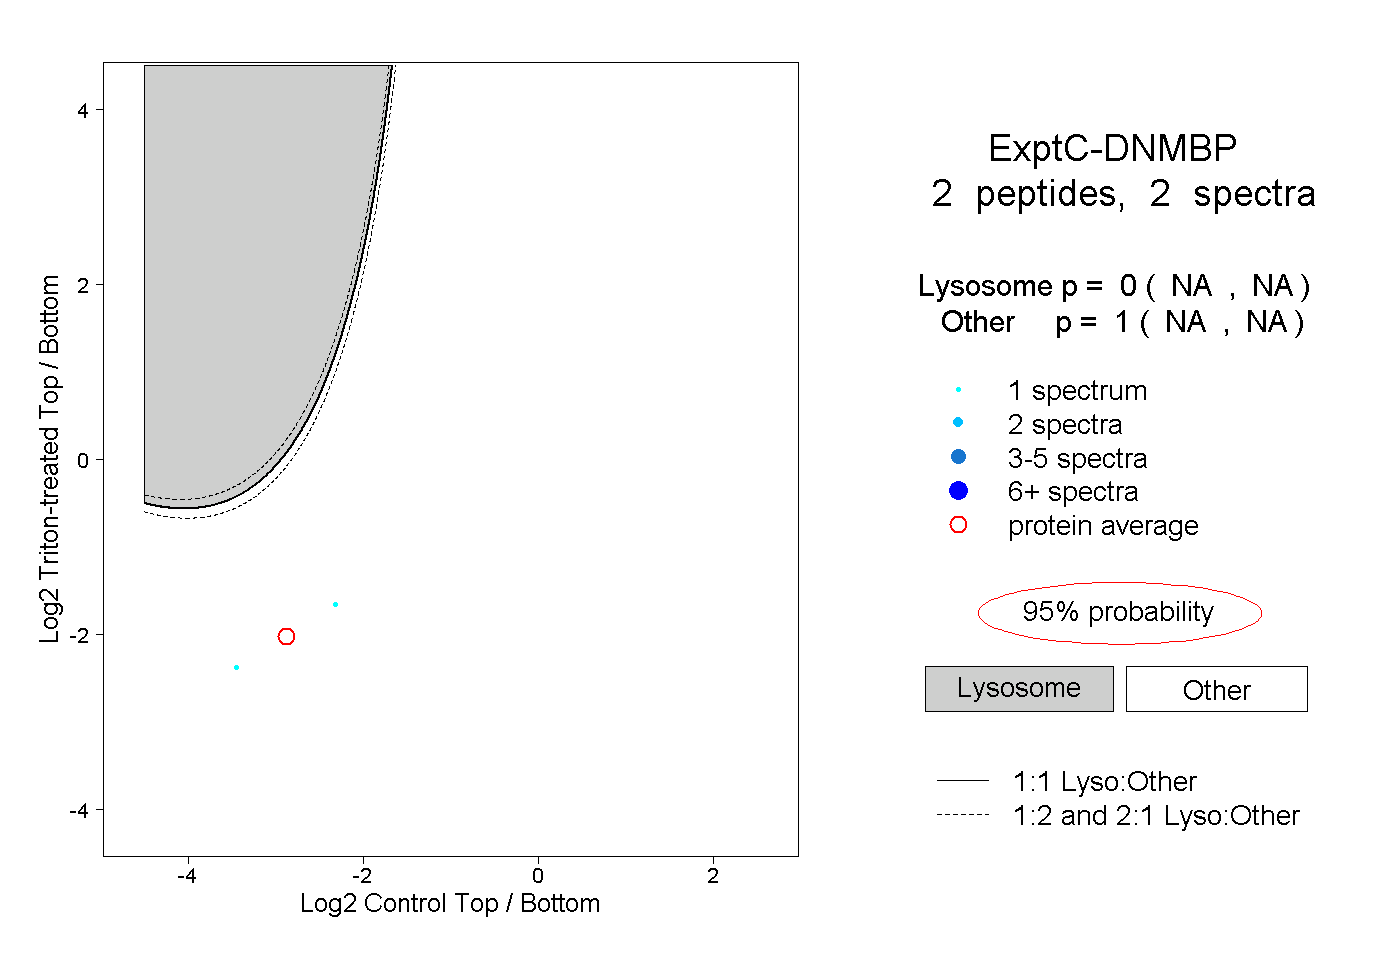
NA | NA
NA | NA
1peptide
spectrum
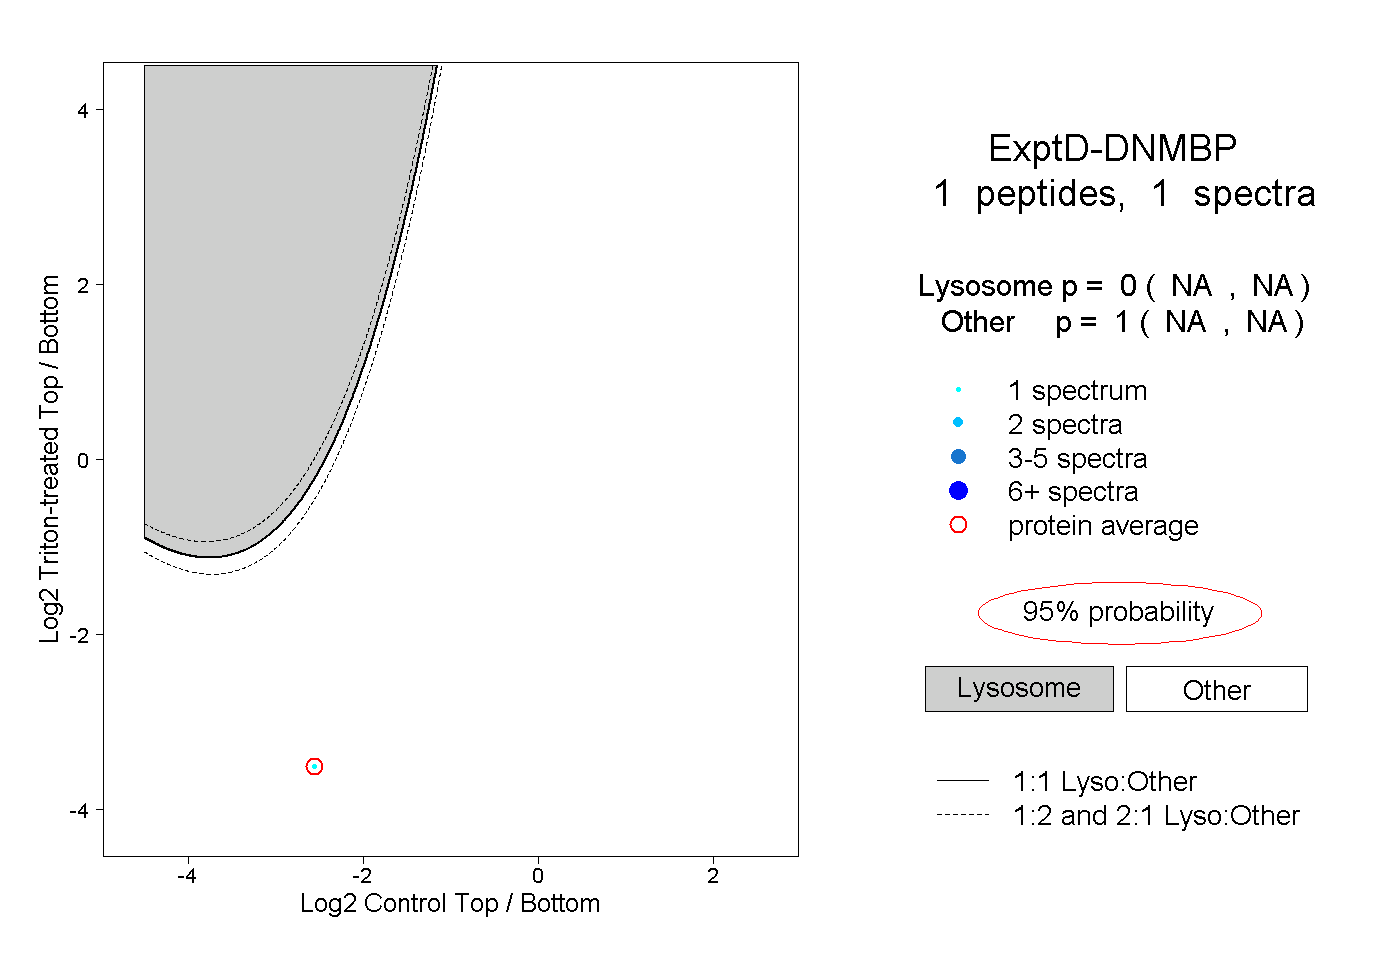
NA | NA
NA | NA