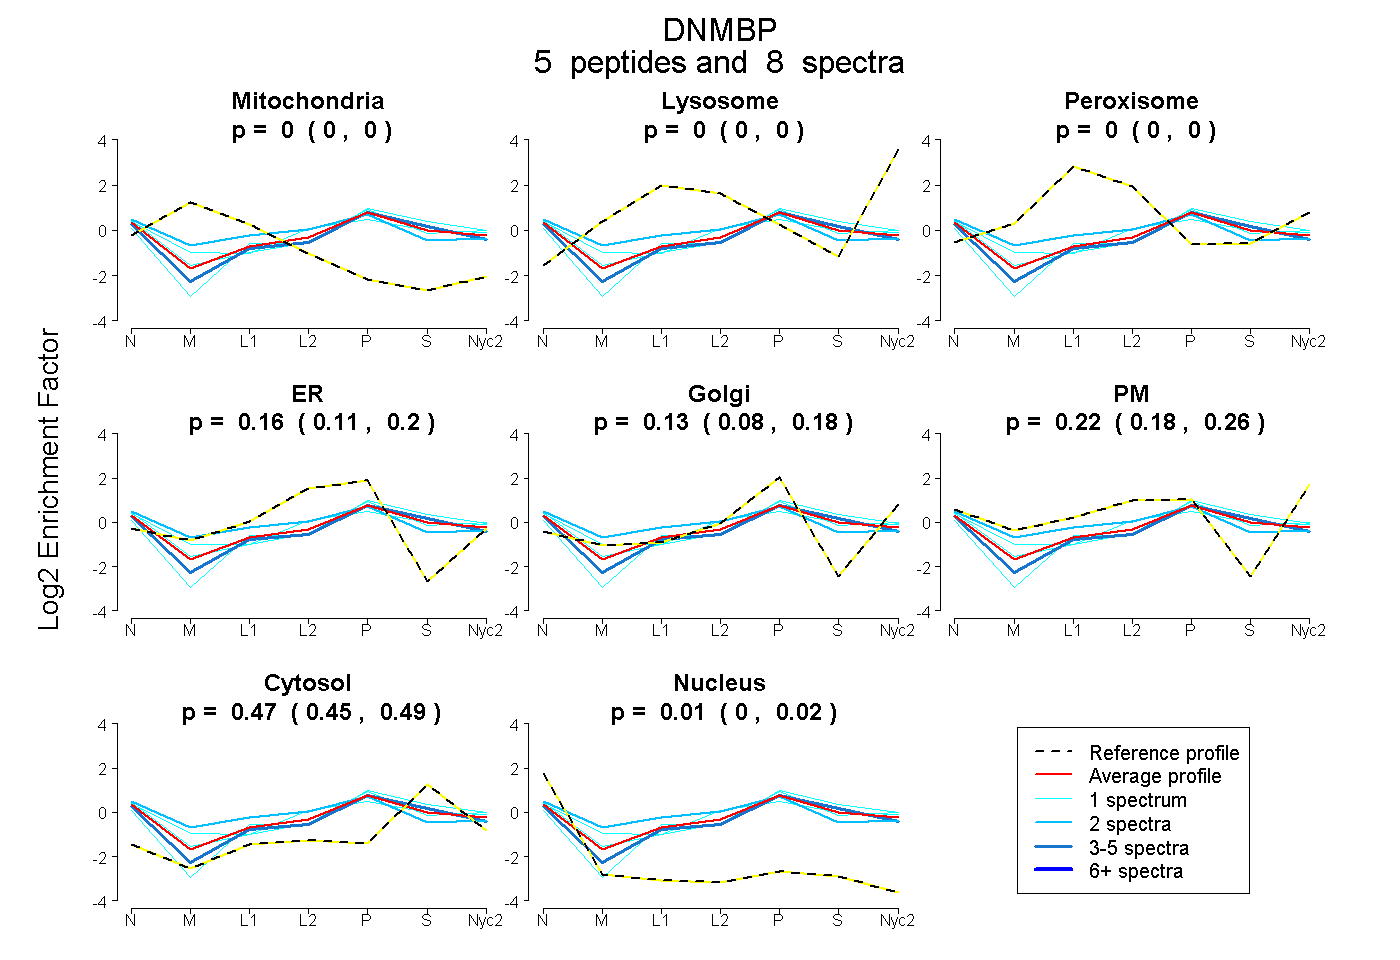
 5
5peptides
spectra
0.000 | 0.000
0.000 | 0.000
0.000 | 0.000
0.110 | 0.196
0.079 | 0.179
0.180 | 0.260
0.450 | 0.492
0.000 | 0.024
| Plot | Mito | Lyso | Perox | ER | Golgi | PM | Cytosol | Nucleus | |||||
| Expt A |
5 peptides |
8 spectra |
|
0.000 0.000 | 0.000 |
0.000 0.000 | 0.000 |
0.000 0.000 | 0.000 |
0.157 0.110 | 0.196 |
0.132 0.079 | 0.179 |
0.224 0.180 | 0.260 |
0.474 0.450 | 0.492 |
0.013 0.000 | 0.024 |
| 3 spectra, LFHVQR | 0.000 | 0.000 | 0.000 | 0.150 | 0.235 | 0.068 | 0.528 | 0.018 | ||
| 1 spectrum, EISQPASTLR | 0.000 | 0.000 | 0.000 | 0.046 | 0.347 | 0.054 | 0.553 | 0.000 | ||
| 1 spectrum, DEAFEETEK | 0.000 | 0.000 | 0.000 | 0.000 | 0.335 | 0.220 | 0.419 | 0.026 | ||
| 1 spectrum, GHHDLEQFEK | 0.000 | 0.000 | 0.000 | 0.144 | 0.000 | 0.380 | 0.463 | 0.013 | ||
| 2 spectra, TLEDLQSAR | 0.000 | 0.000 | 0.121 | 0.246 | 0.019 | 0.251 | 0.299 | 0.064 |
| Plot | Lyso | Other | |||||||||||
| Expt C |
2 peptides |
2 spectra |
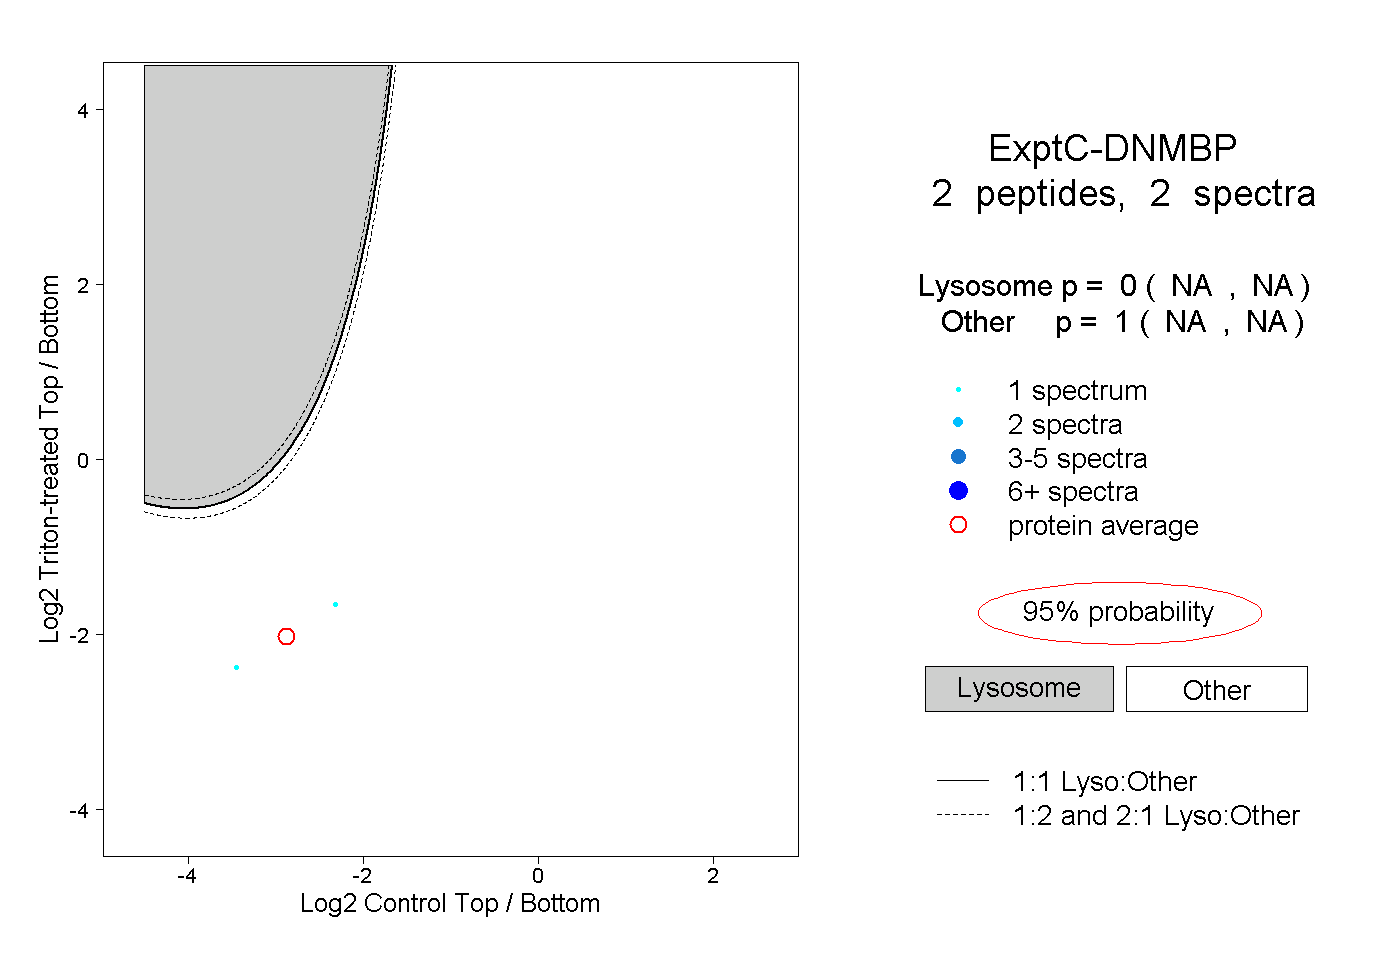 |
0.000 NA | NA |
1.000 NA | NA |
||||||||
| Plot | Lyso | Other | |||||||||||
| Expt D |
1 peptide |
1 spectrum |
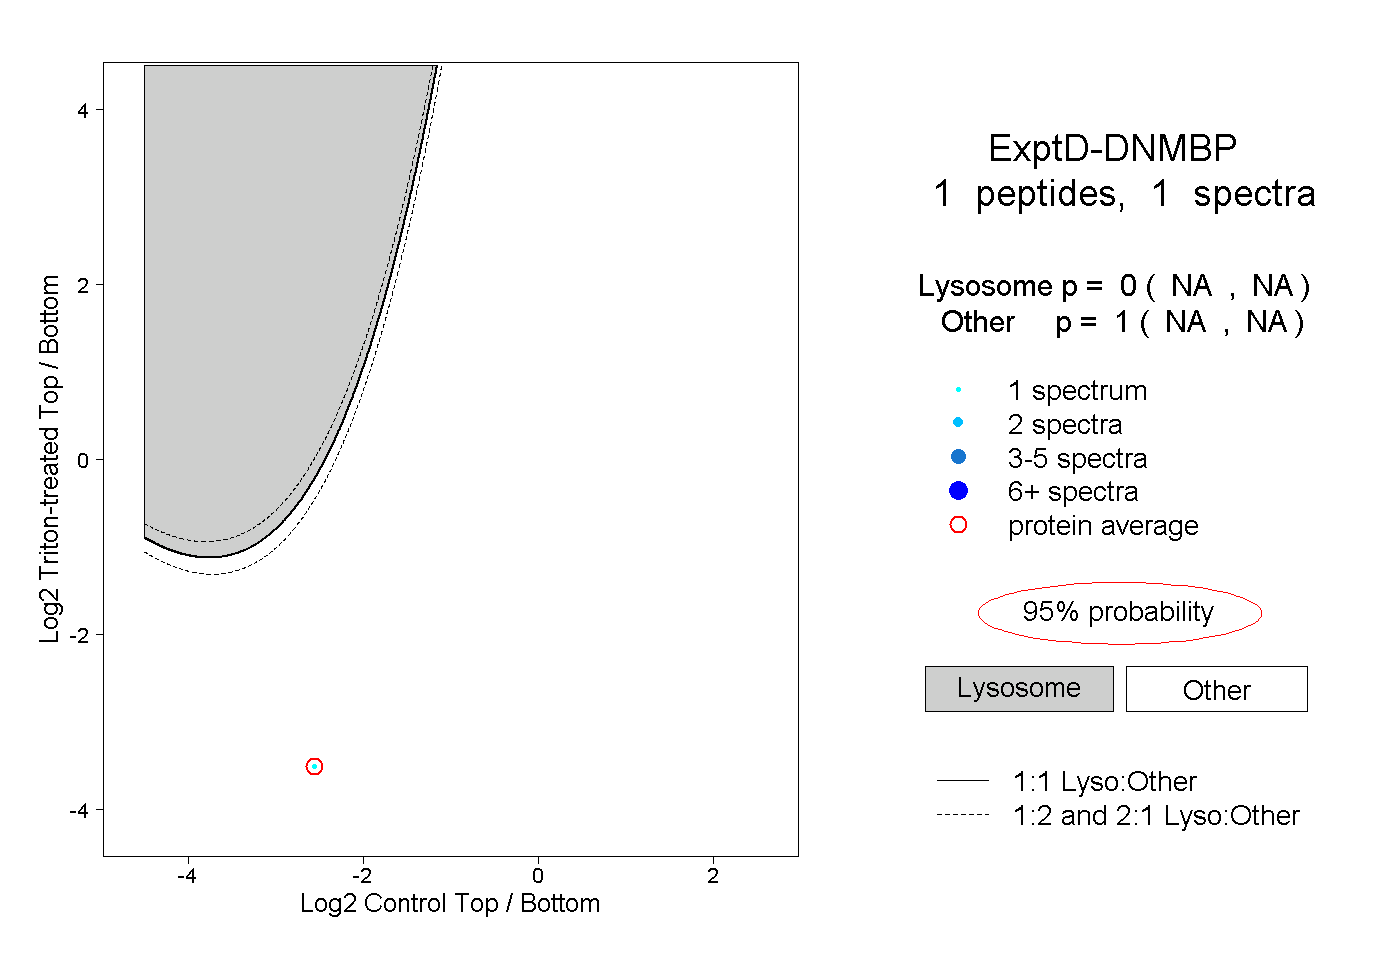 |
0.000 NA | NA |
1.000 NA | NA |