 3
3peptides
spectra
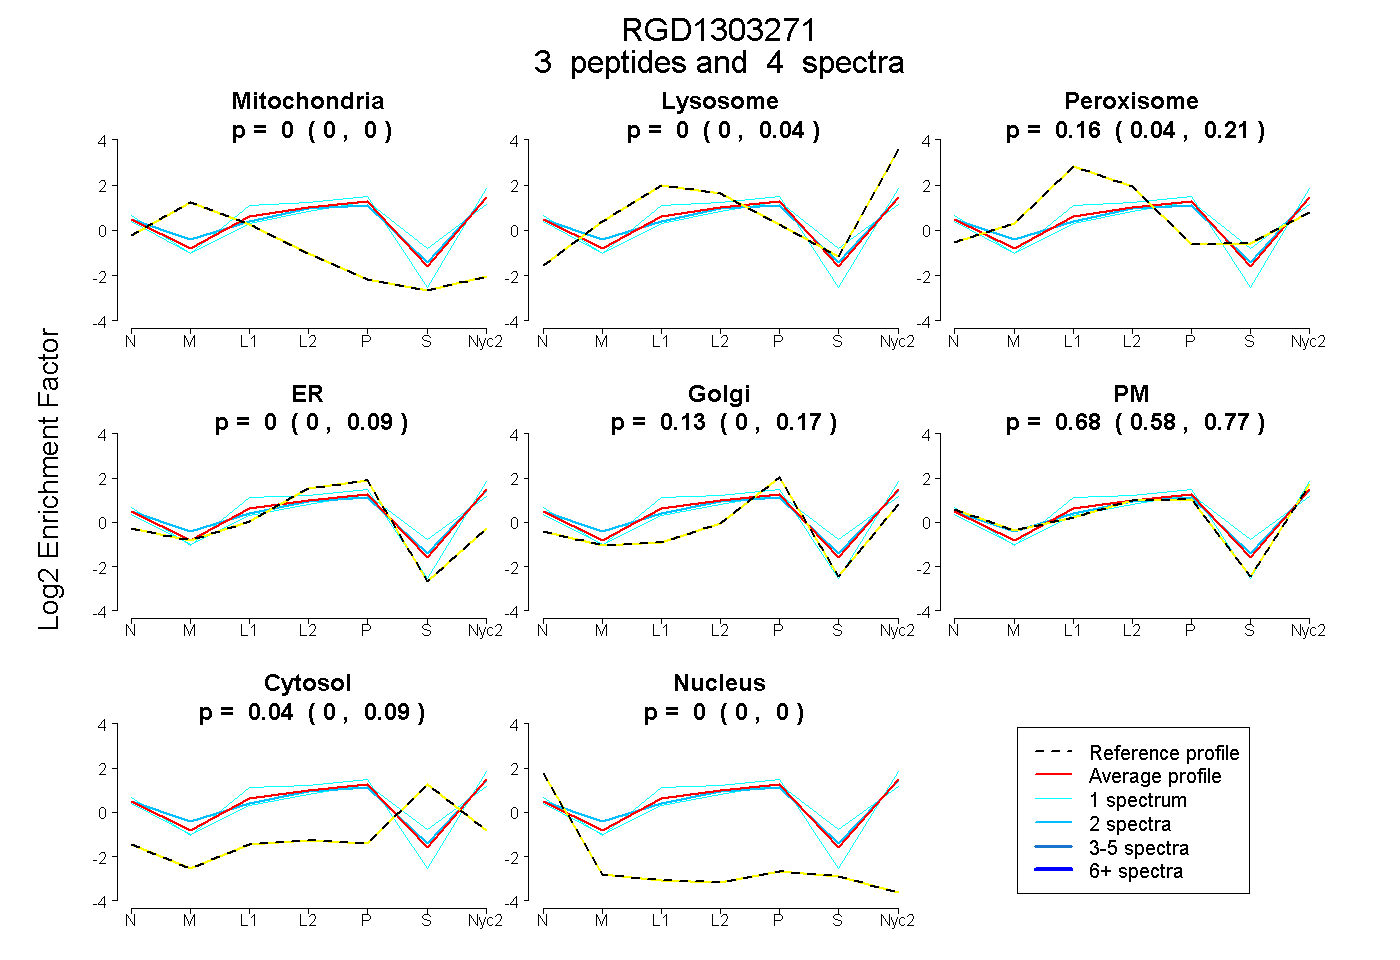
0.000 | 0.000
0.000 | 0.043
0.045 | 0.209
0.000 | 0.087
0.000 | 0.171
0.584 | 0.768
0.000 | 0.087
0.000 | 0.000
1peptide
spectrum
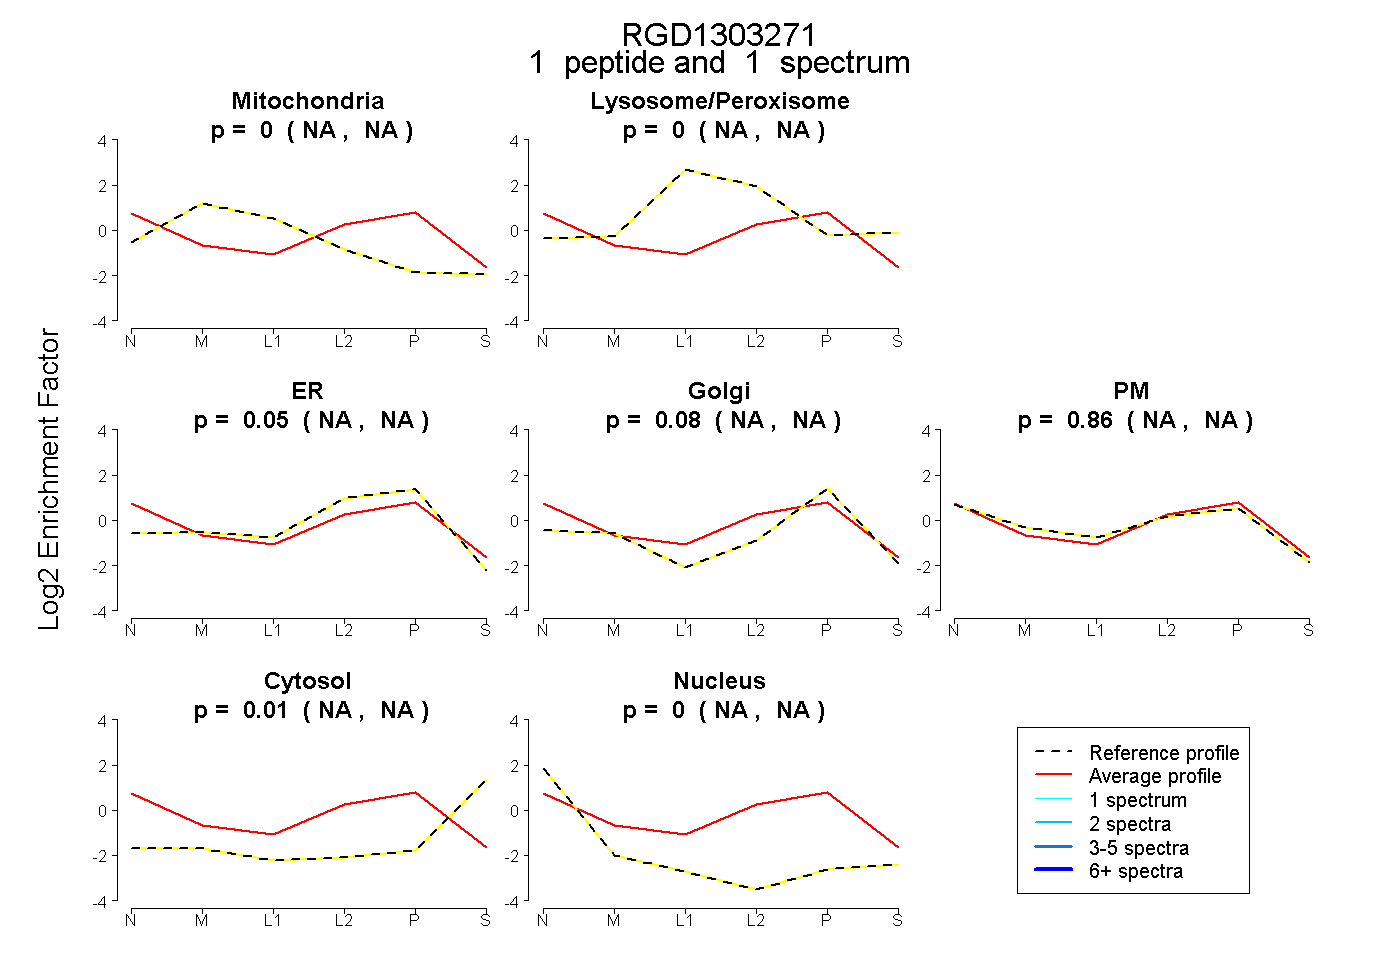
NA | NA
NA | NA
NA | NA
NA | NA
NA | NA
NA | NA
NA | NA
2peptides
spectra
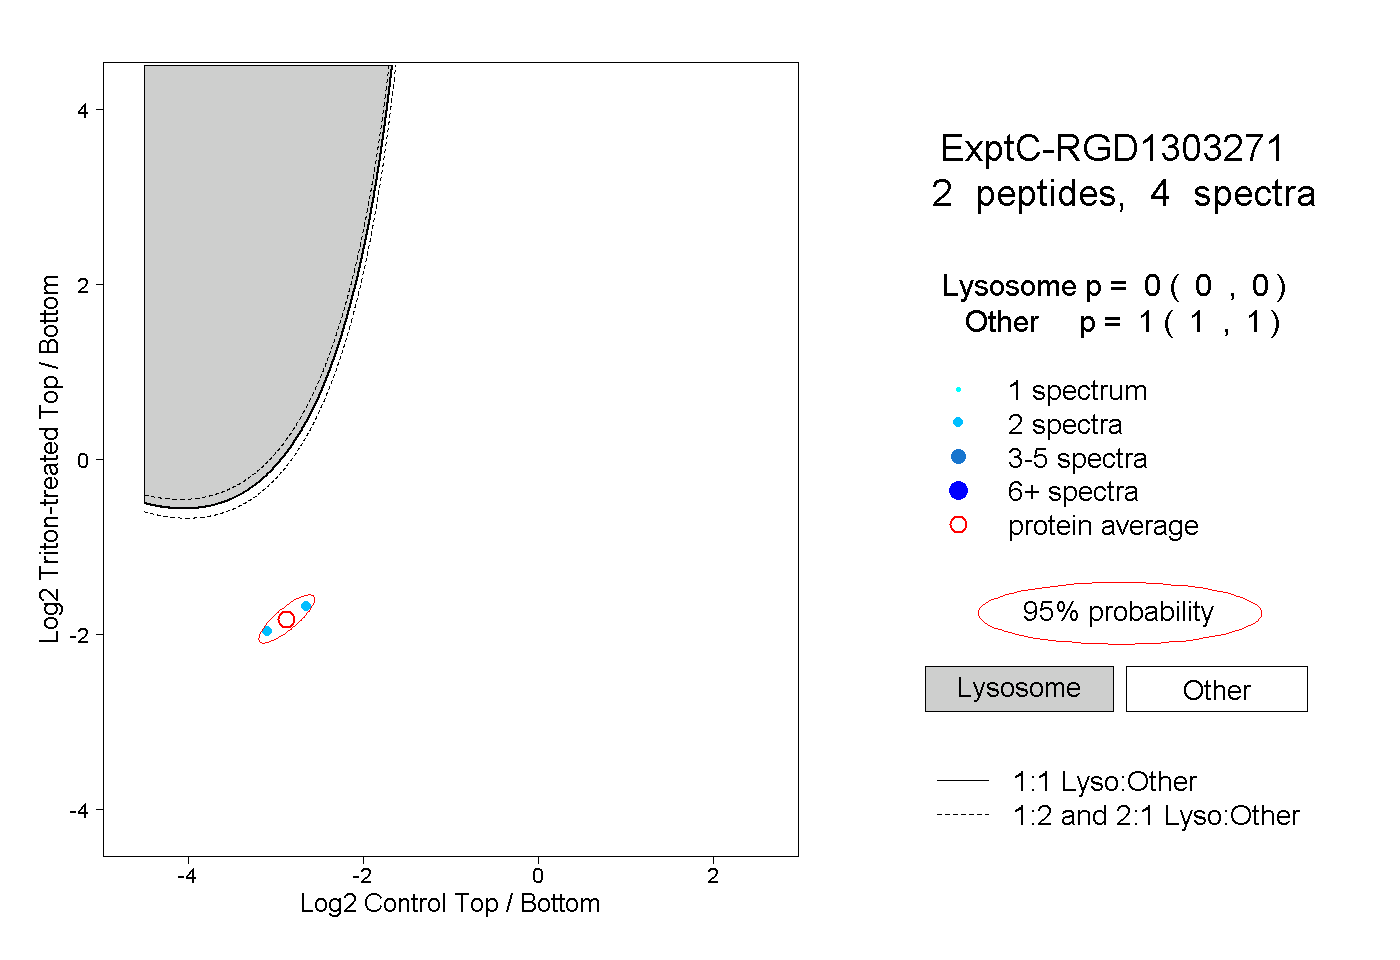
0.000 | 0.000
1.000 | 1.000