 3
3peptides
spectra
0.000 | 0.000
0.000 | 0.043
0.045 | 0.209
0.000 | 0.087
0.000 | 0.171
0.584 | 0.768
0.000 | 0.087
0.000 | 0.000
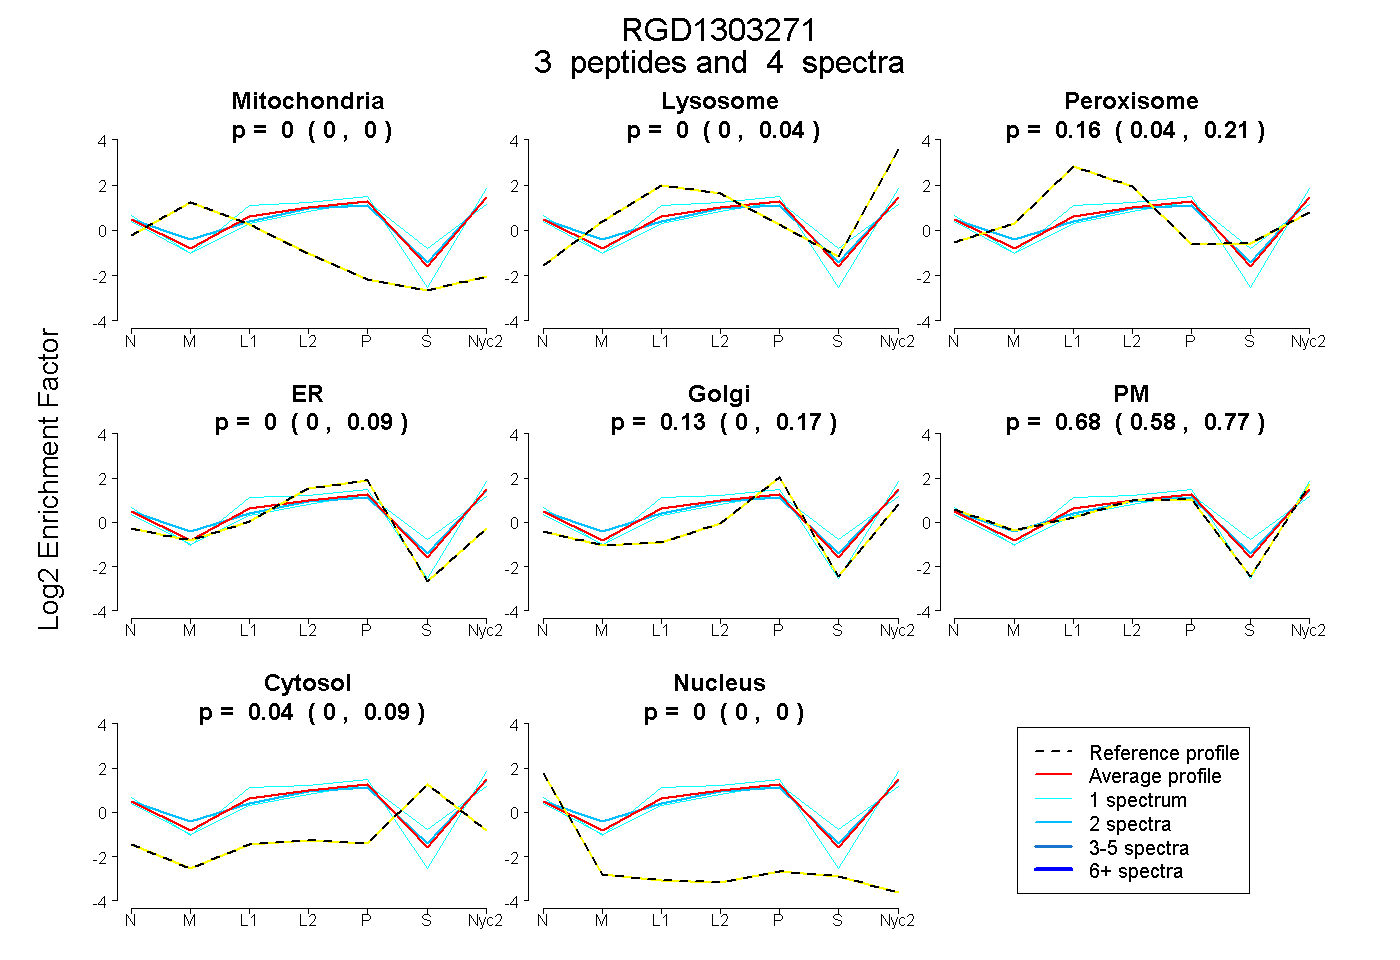
| Plot | Mito | Lyso | Perox | ER | Golgi | PM | Cytosol | Nucleus | |||||
| Expt A |
3 peptides |
4 spectra |
|
0.000 0.000 | 0.000 |
0.000 0.000 | 0.043 |
0.156 0.045 | 0.209 |
0.000 0.000 | 0.087 |
0.127 0.000 | 0.171 |
0.681 0.584 | 0.768 |
0.036 0.000 | 0.087 |
0.000 0.000 | 0.000 |
| 1 spectrum, EIDVLIFK | 0.000 | 0.000 | 0.163 | 0.000 | 0.162 | 0.523 | 0.152 | 0.000 | ||
| 1 spectrum, GIPVYPYR | 0.000 | 0.060 | 0.024 | 0.083 | 0.000 | 0.833 | 0.000 | 0.000 | ||
| 2 spectra, SRPQTSEGR | 0.000 | 0.010 | 0.137 | 0.000 | 0.062 | 0.724 | 0.067 | 0.000 |
| Plot | Mito | Lyso or Perox | ER | Golgi | PM | Cytosol | Nucleus | ||||||
| Expt B |
1 peptide |
1 spectrum |
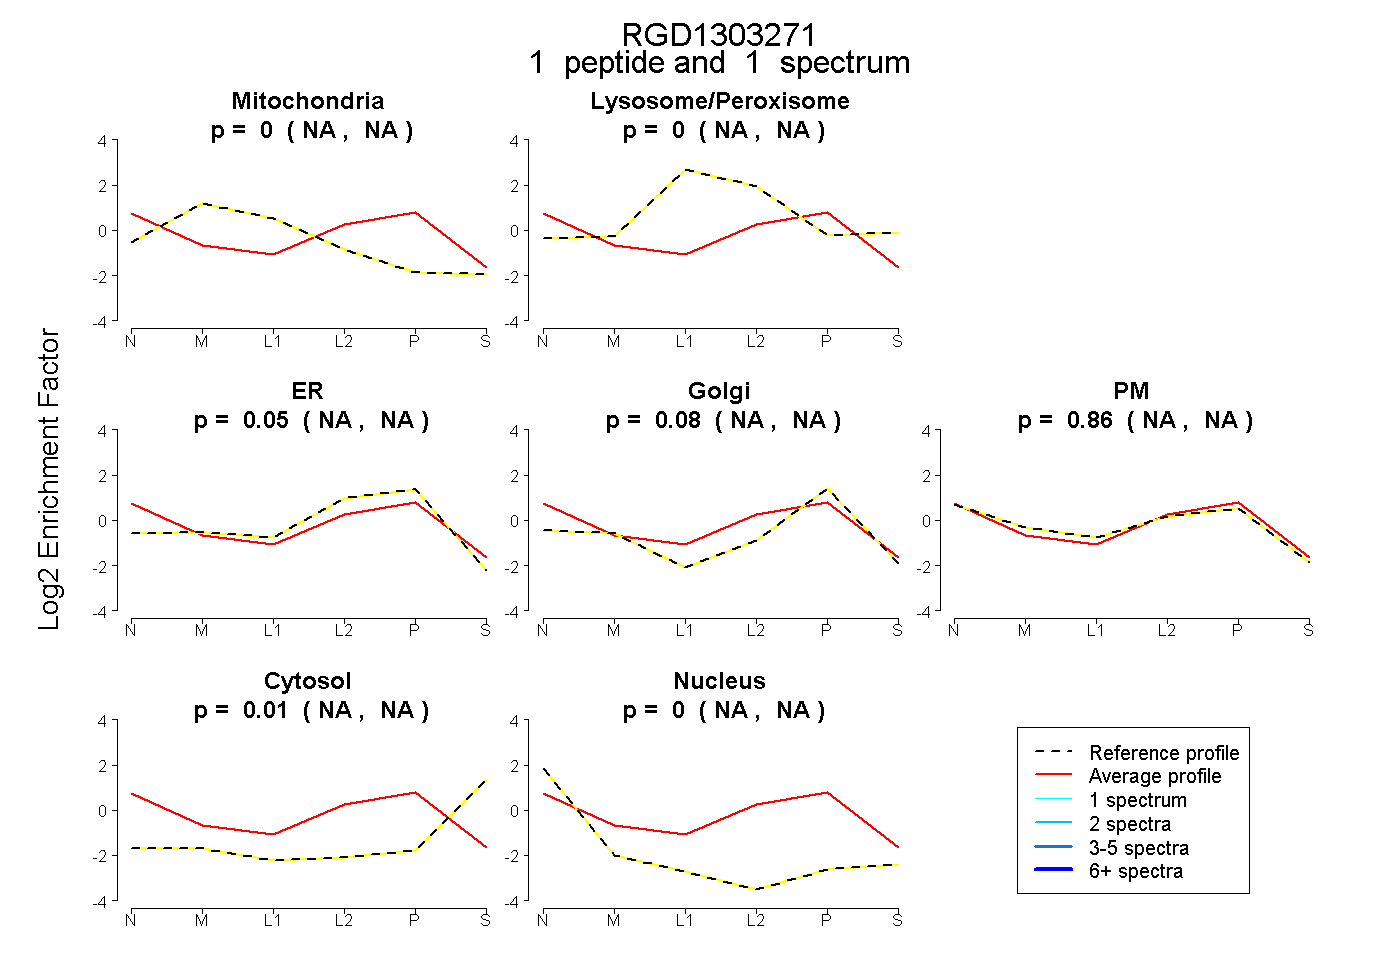 |
0.000 NA | NA |
0.000 NA | NA |
0.045 NA | NA |
0.083 NA | NA |
0.860 NA | NA |
0.012 NA | NA |
0.000 NA | NA |
|||
| Plot | Lyso | Other | |||||||||||
| Expt C |
2 peptides |
4 spectra |
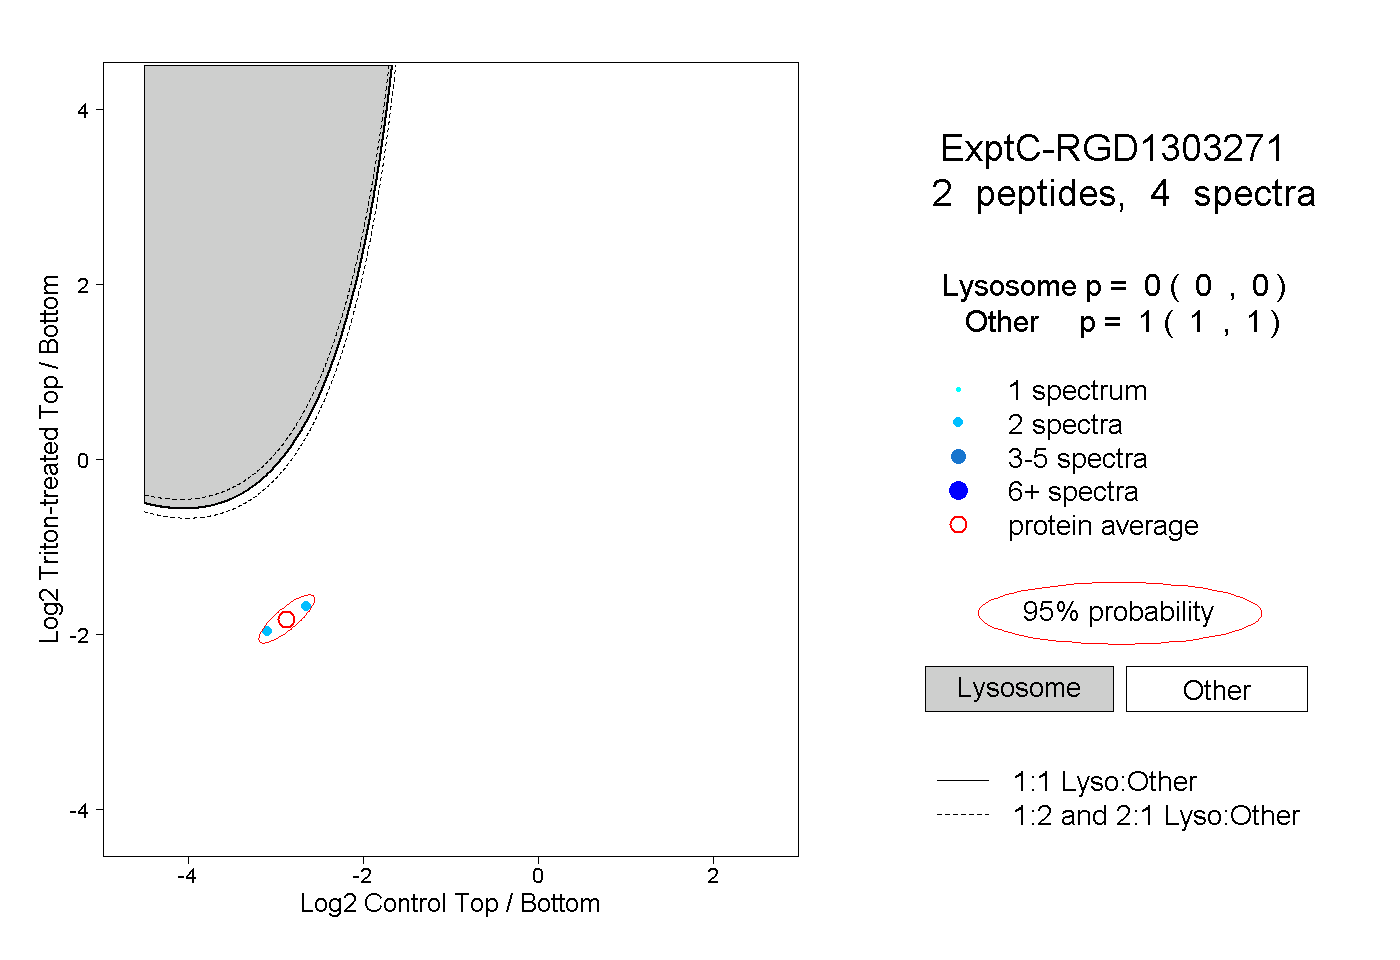 |
0.000 0.000 | 0.000 |
1.000 1.000 | 1.000 |