 3
3peptides
spectra
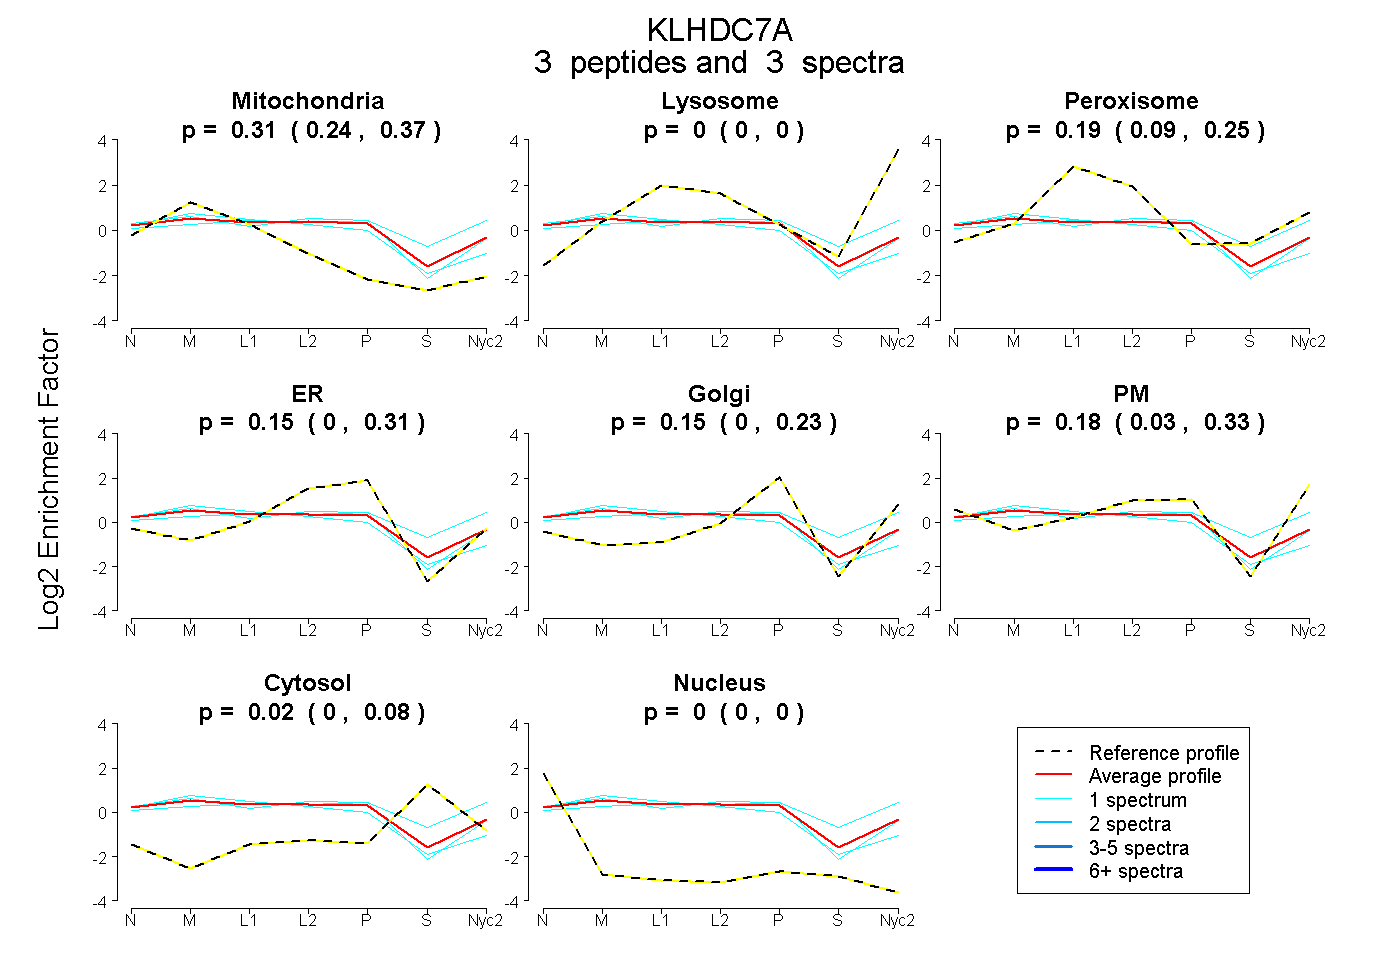
0.242 | 0.367
0.000 | 0.000
0.088 | 0.254
0.000 | 0.311
0.000 | 0.231
0.029 | 0.328
0.000 | 0.083
0.000 | 0.000
5peptides
spectra
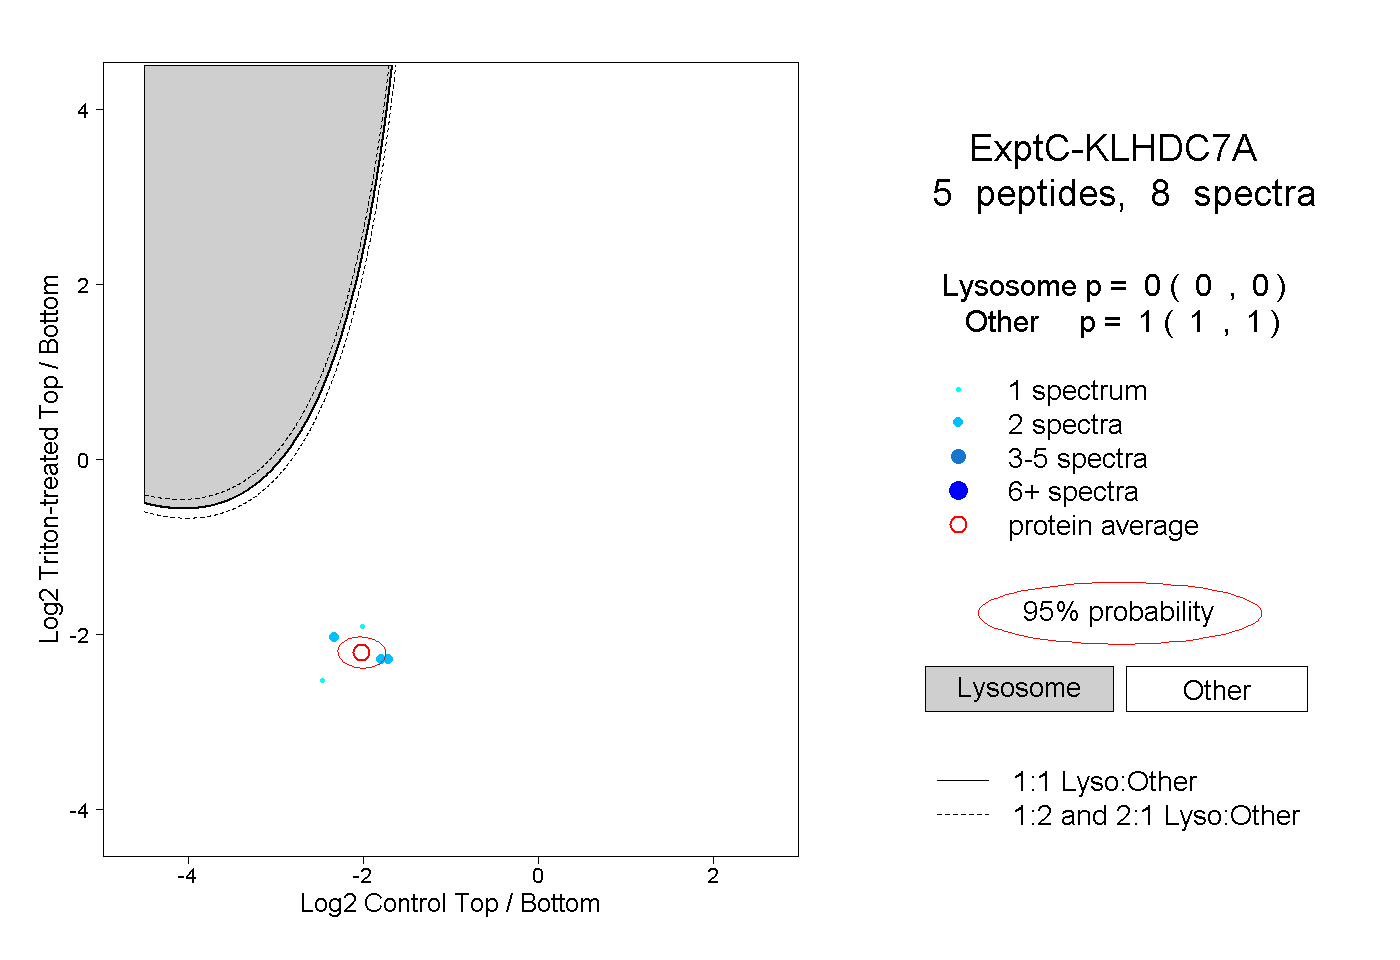
0.000 | 0.000
1.000 | 1.000
1peptide
spectrum
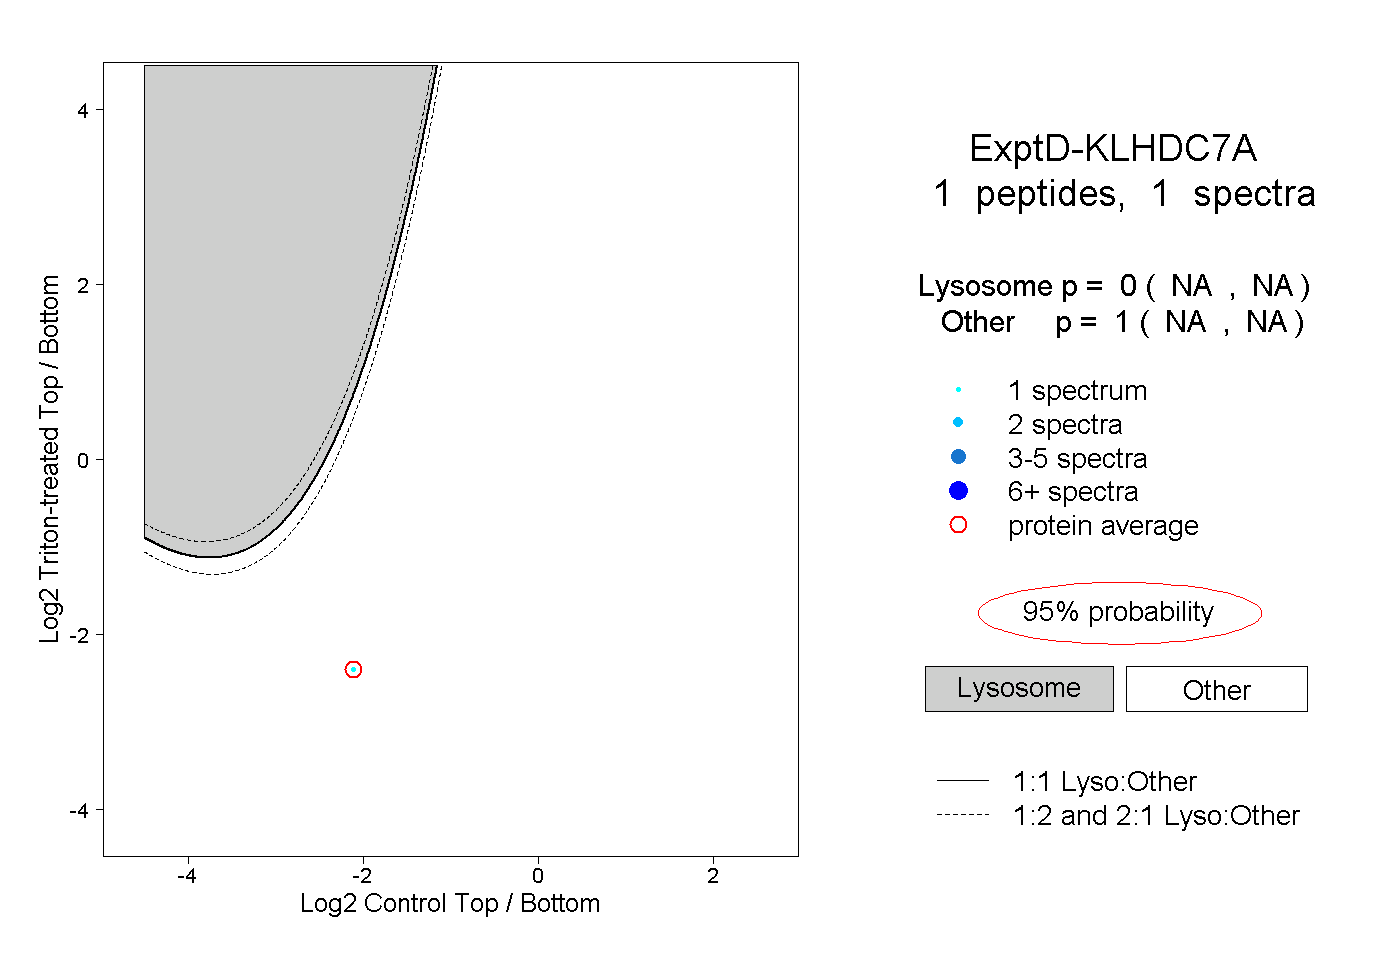
NA | NA
NA | NA