 3
3peptides
spectra
0.242 | 0.367
0.000 | 0.000
0.088 | 0.254
0.000 | 0.311
0.000 | 0.231
0.029 | 0.328
0.000 | 0.083
0.000 | 0.000
| Plot | Mito | Lyso | Perox | ER | Golgi | PM | Cytosol | Nucleus | |||||
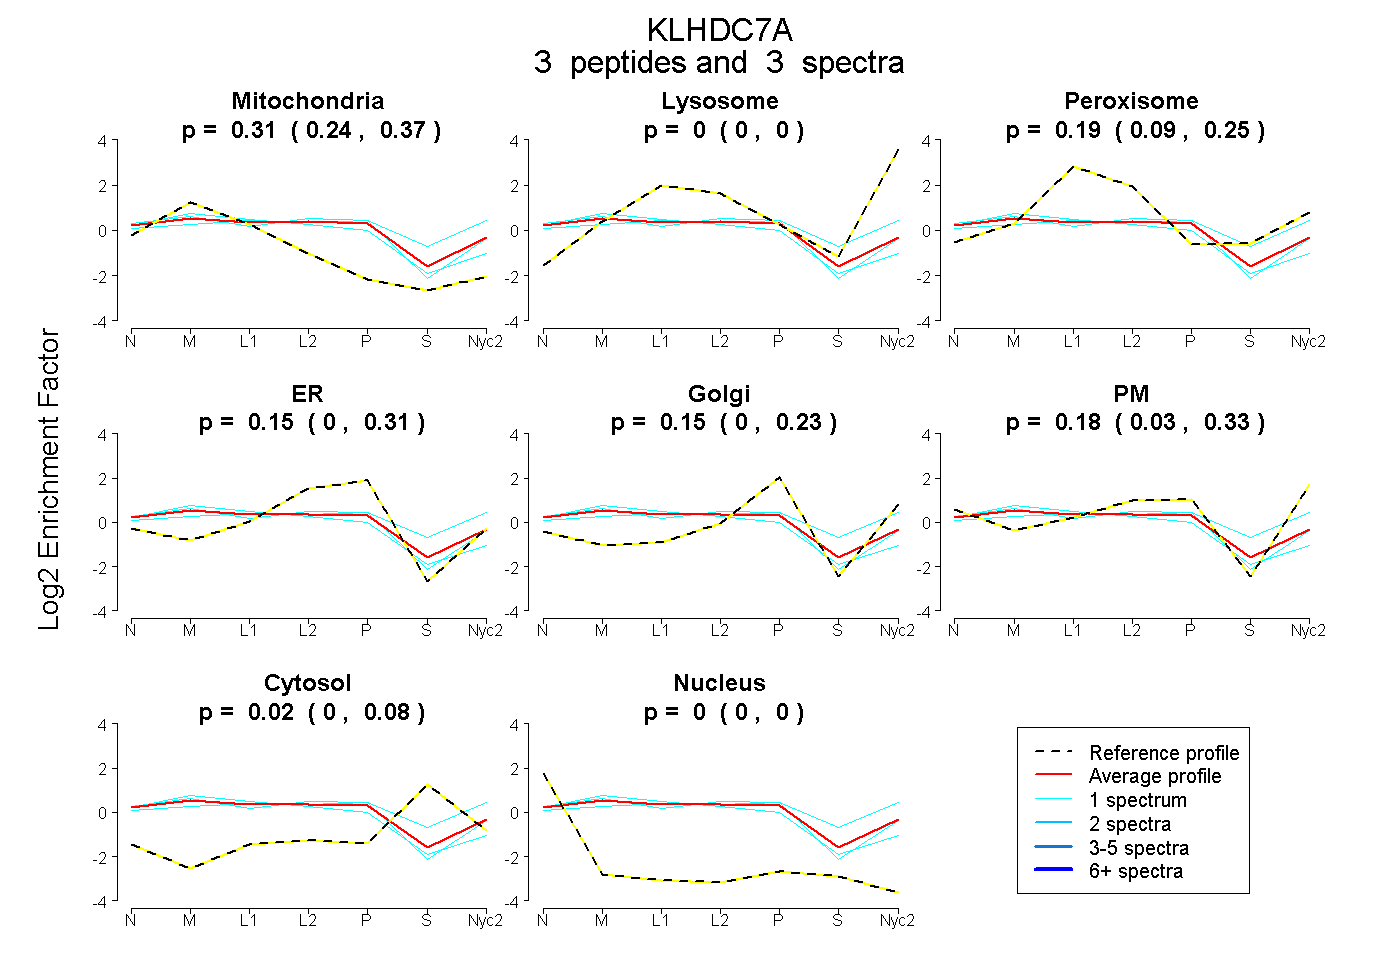
| Expt A |
3 peptides |
3 spectra |
|
0.313 0.242 | 0.367 |
0.000 0.000 | 0.000 |
0.192 0.088 | 0.254 |
0.147 0.000 | 0.311 |
0.149 0.000 | 0.231 |
0.176 0.029 | 0.328 |
0.022 0.000 | 0.083 |
0.000 0.000 | 0.000 |
| 1 spectrum, CLVVADMCPQEDSGR | 0.465 | 0.000 | 0.128 | 0.338 | 0.000 | 0.069 | 0.000 | 0.000 | ||
| 1 spectrum, SLGISVYR | 0.103 | 0.000 | 0.305 | 0.000 | 0.166 | 0.279 | 0.147 | 0.000 | ||
| 1 spectrum, FVPNELQGFPAAR | 0.346 | 0.000 | 0.042 | 0.304 | 0.000 | 0.308 | 0.000 | 0.000 |
| Plot | Lyso | Other | |||||||||||
| Expt C |
5 peptides |
8 spectra |
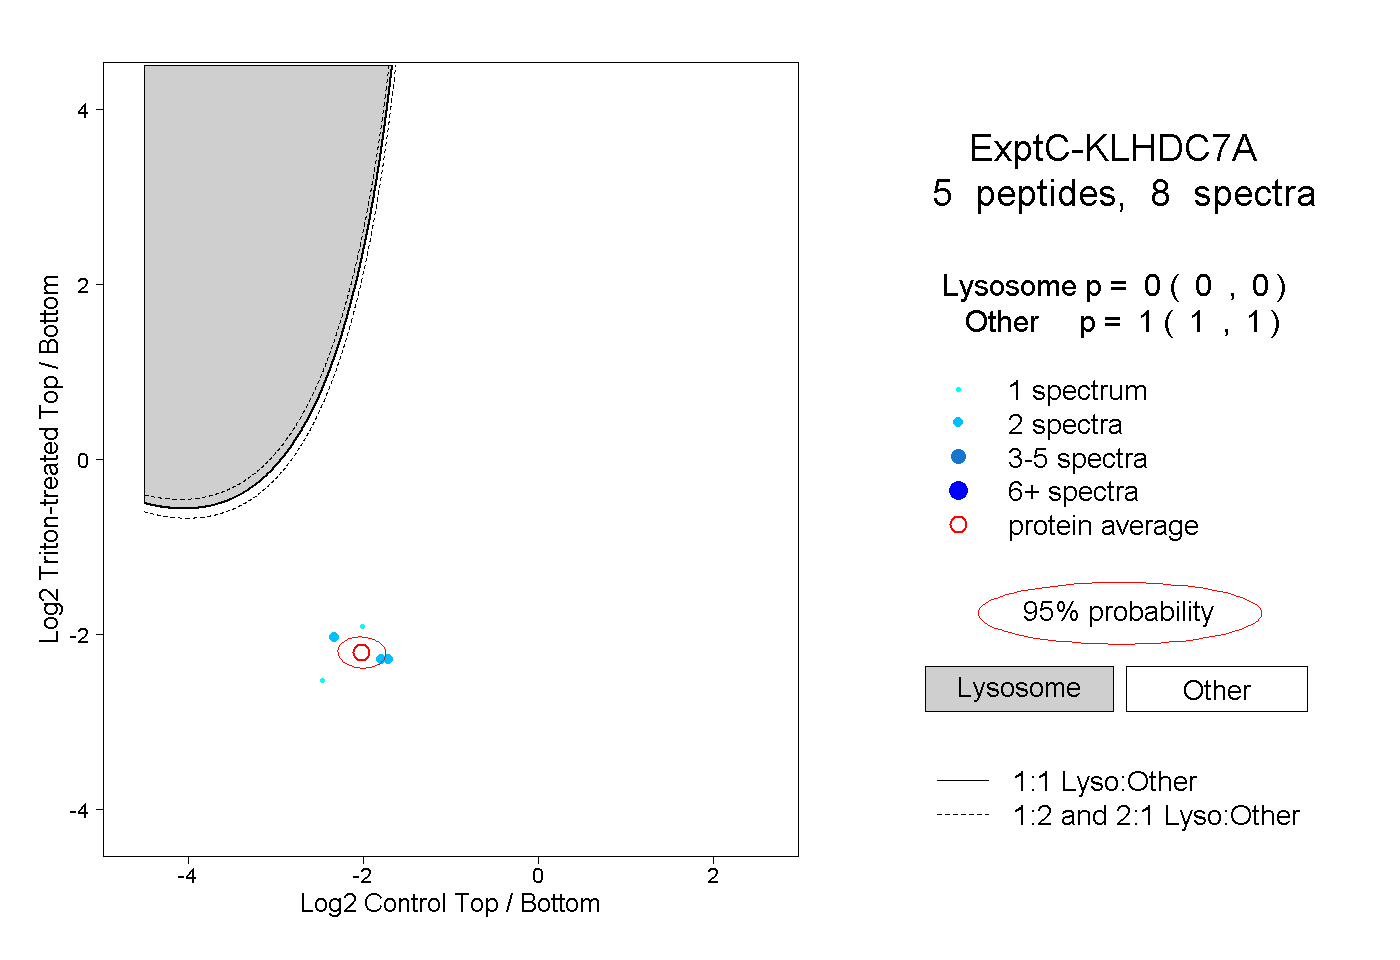 |
0.000 0.000 | 0.000 |
1.000 1.000 | 1.000 |
||||||||
| Plot | Lyso | Other | |||||||||||
| Expt D |
1 peptide |
1 spectrum |
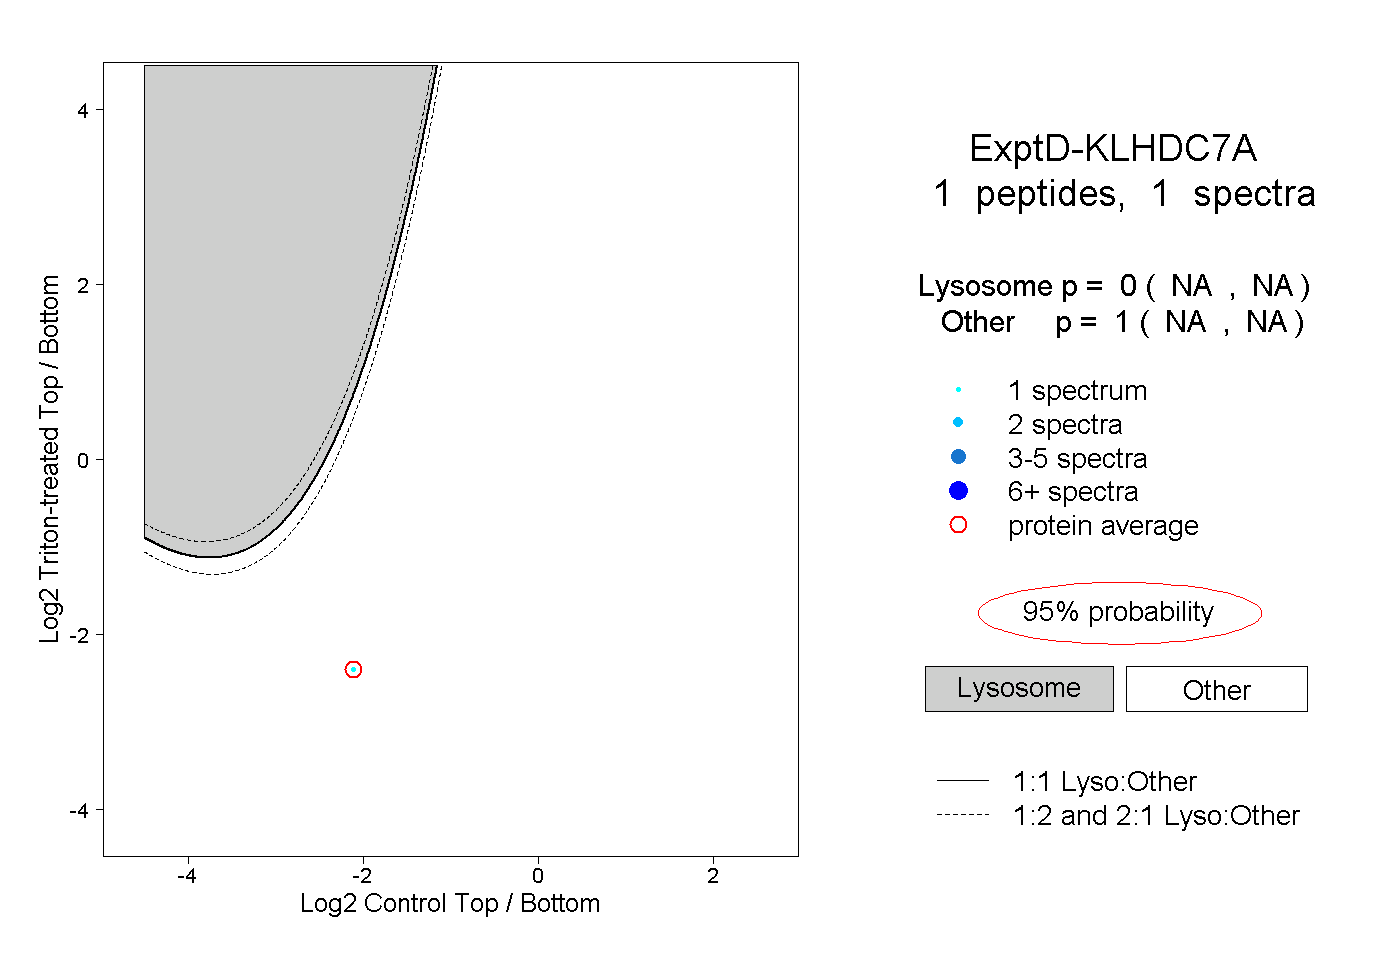 |
0.000 NA | NA |
1.000 NA | NA |