 7
7peptides
spectra
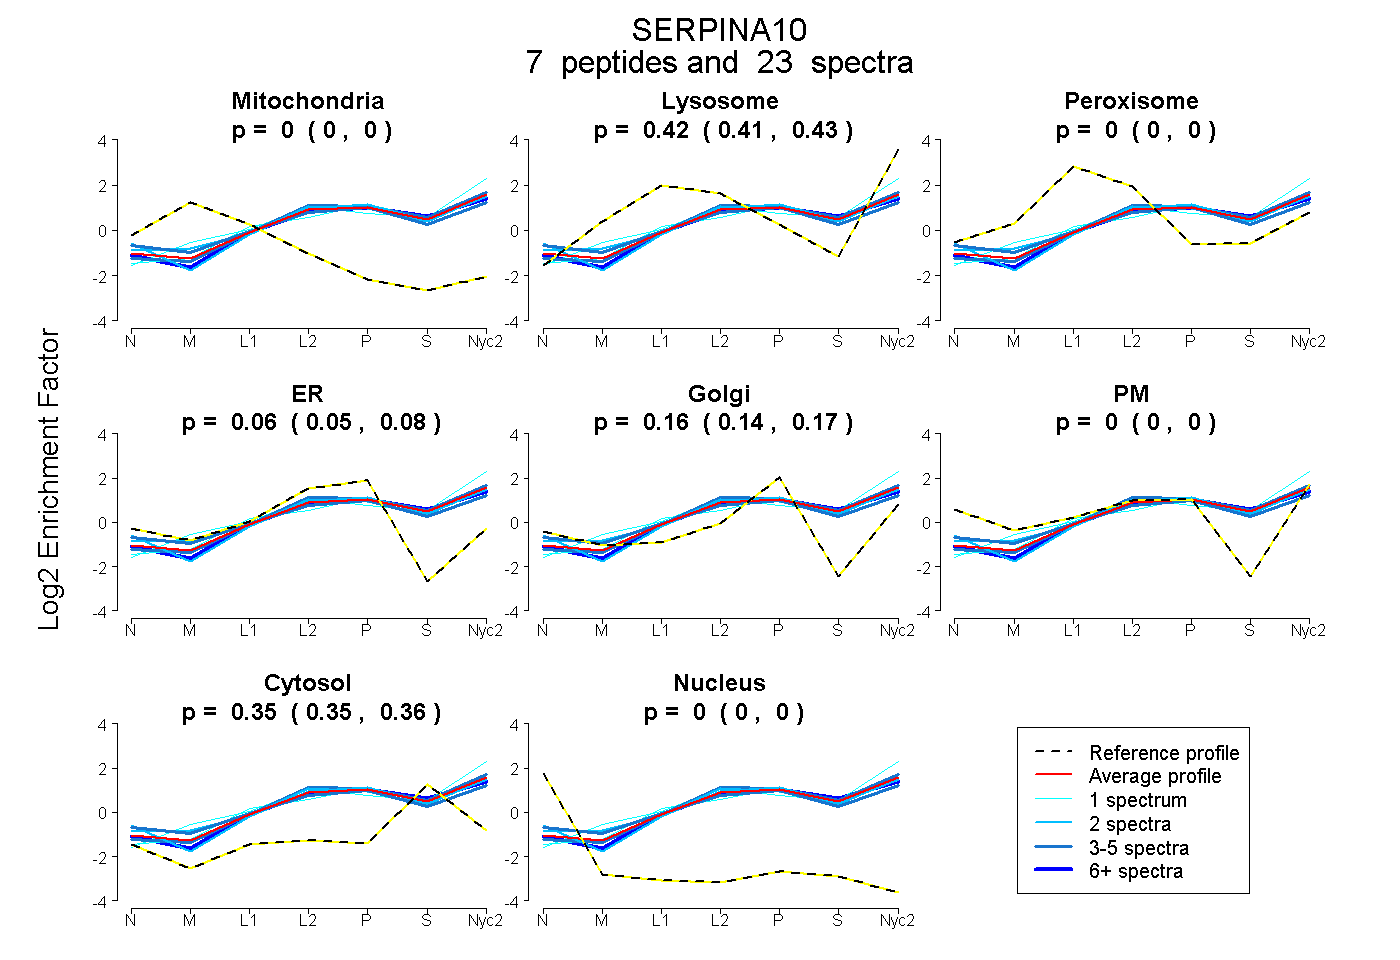
0.000 | 0.000
0.412 | 0.427
0.000 | 0.000
0.046 | 0.080
0.145 | 0.175
0.000 | 0.000
0.347 | 0.357
0.000 | 0.000
3peptides
spectra
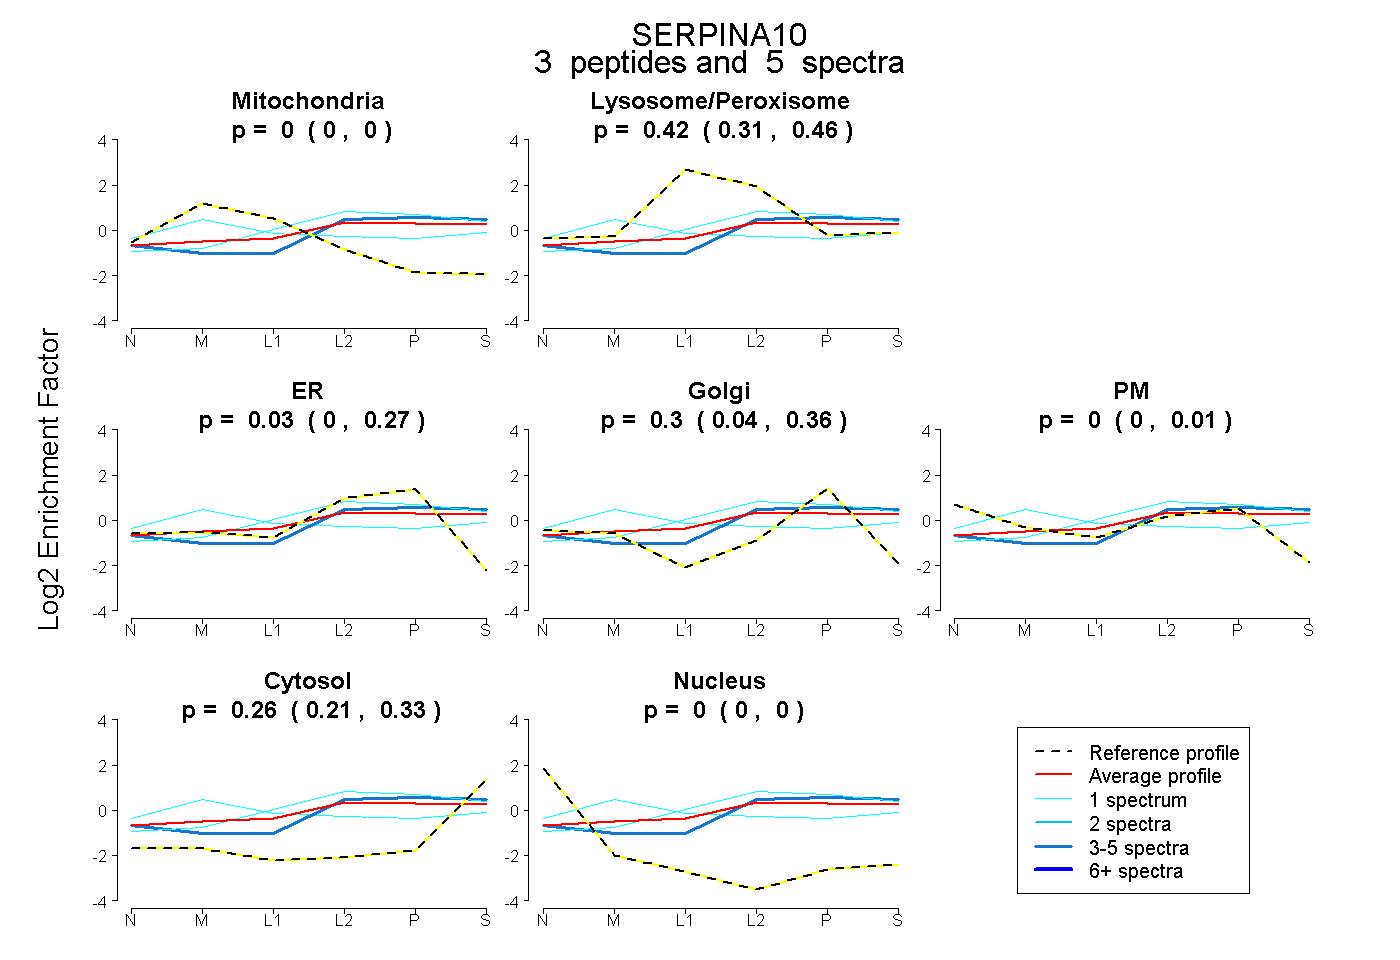
0.000 | 0.000
0.308 | 0.458
0.000 | 0.270
0.039 | 0.359
0.000 | 0.010
0.207 | 0.329
0.000 | 0.000
9peptides
spectra
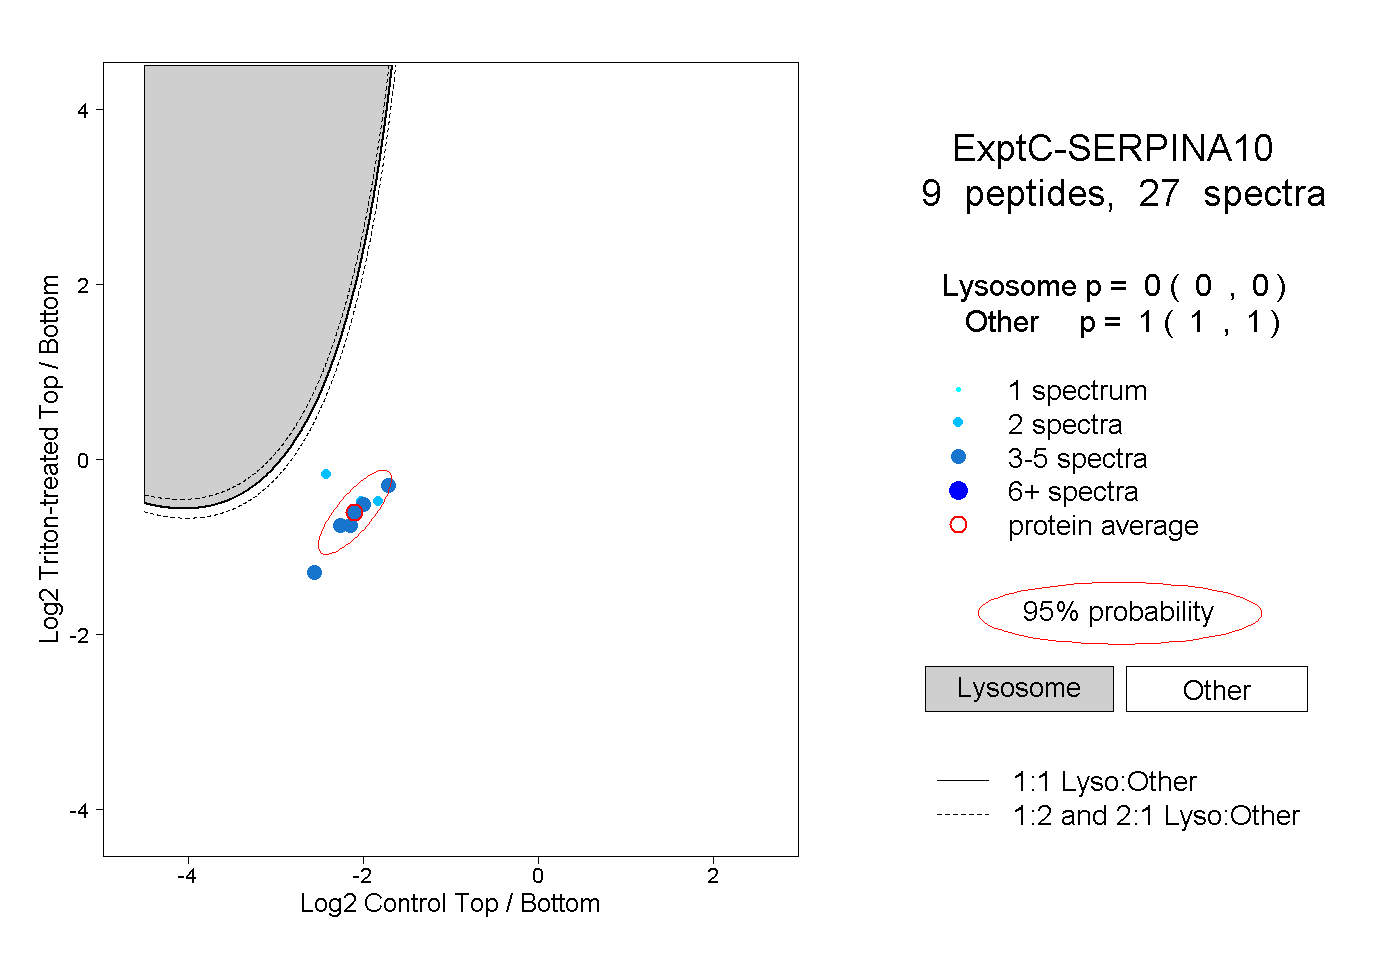
0.000 | 0.000
1.000 | 1.000
1peptide
spectrum
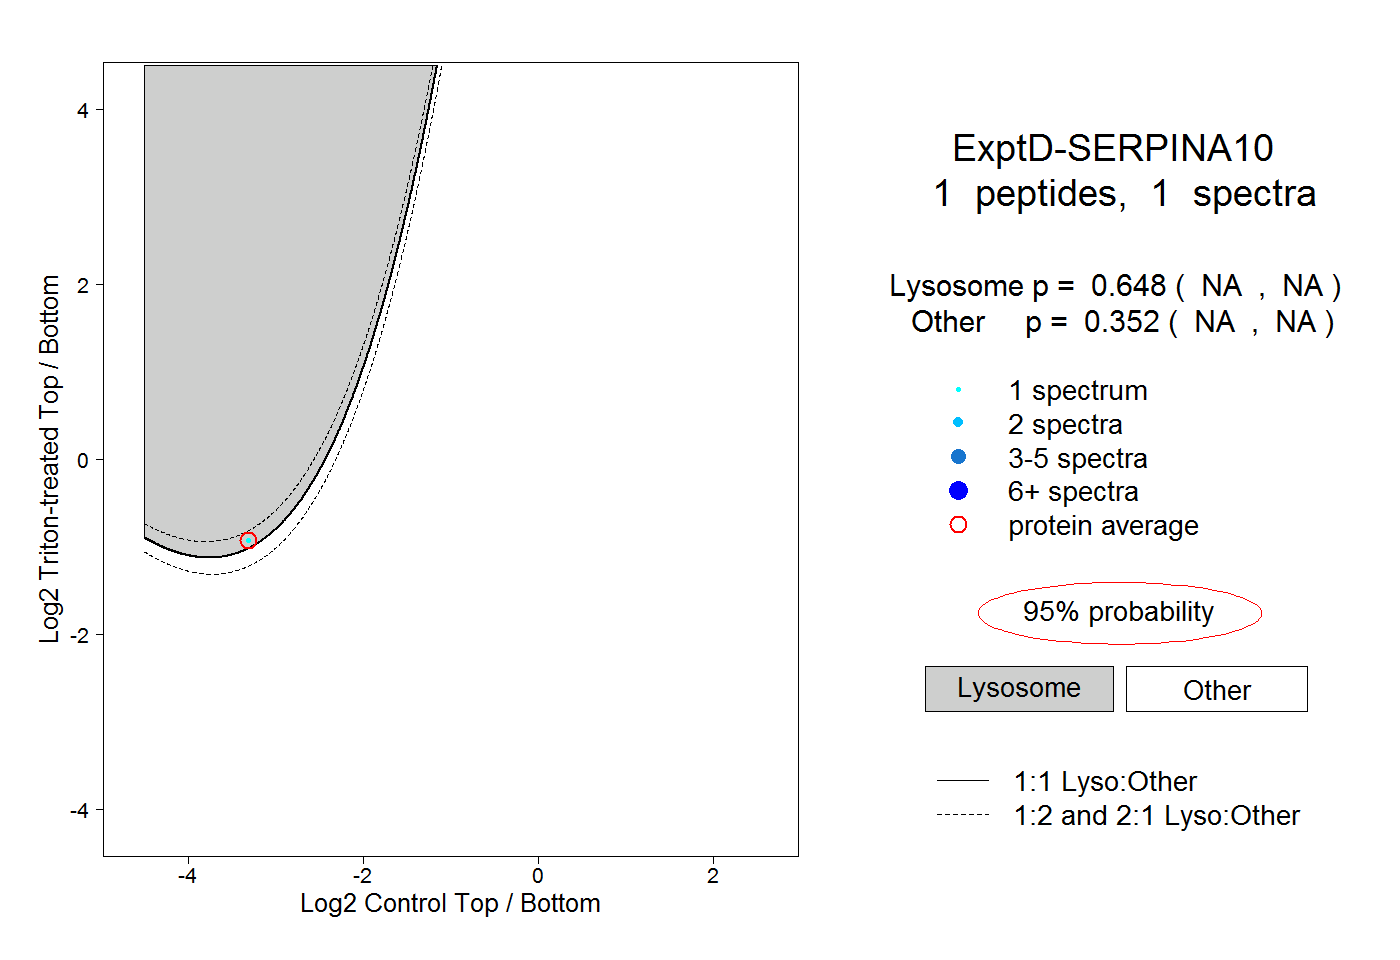
NA | NA
NA | NA