 7
7peptides
spectra
0.000 | 0.000
0.412 | 0.427
0.000 | 0.000
0.046 | 0.080
0.145 | 0.175
0.000 | 0.000
0.347 | 0.357
0.000 | 0.000
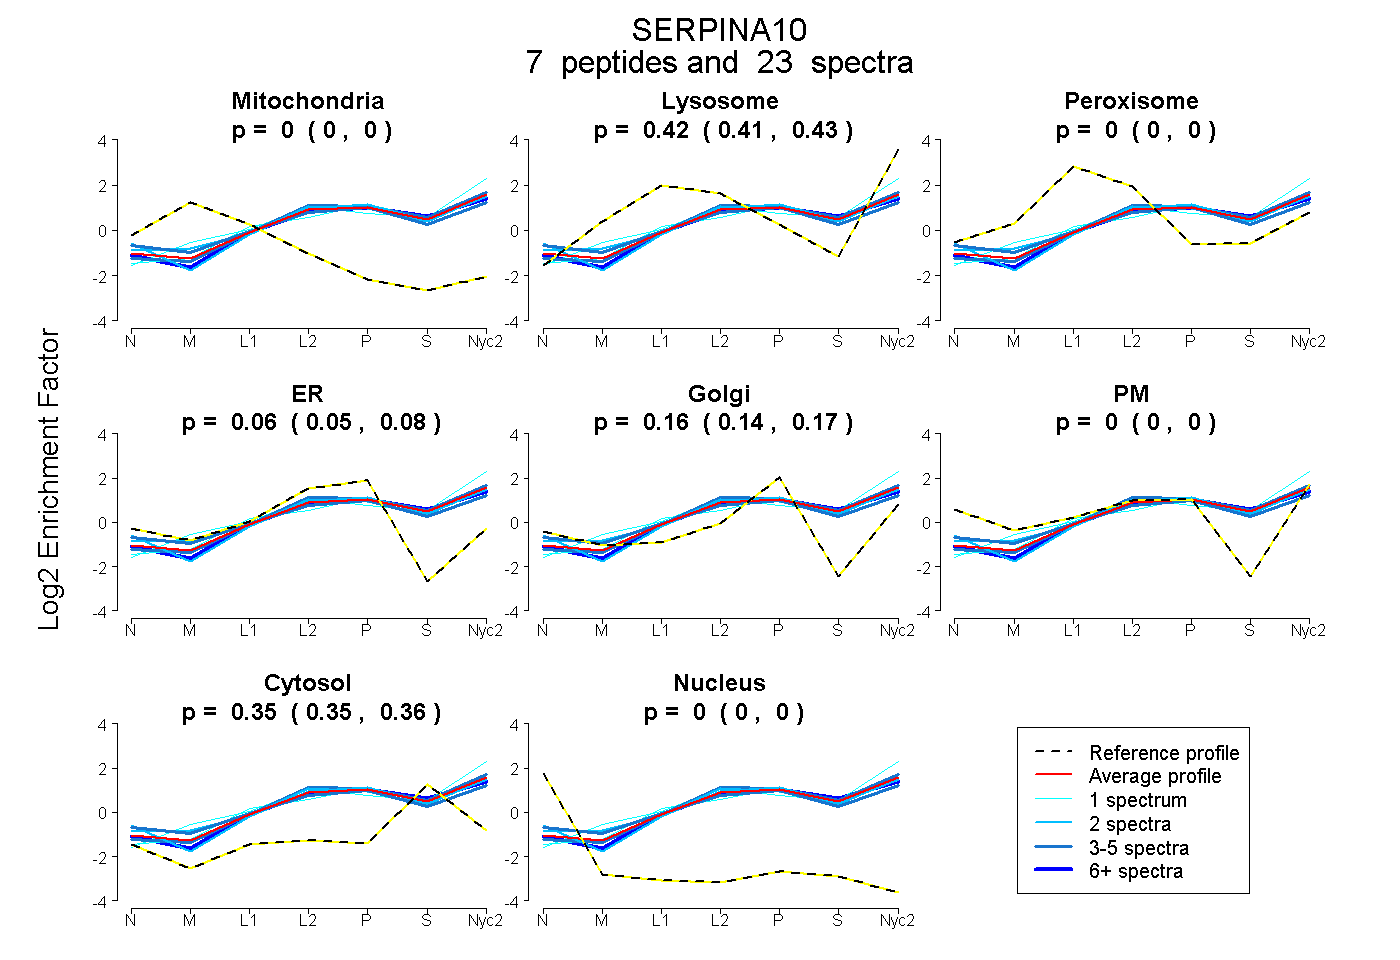
| Plot | Mito | Lyso | Perox | ER | Golgi | PM | Cytosol | Nucleus | |||||
| Expt A |
7 peptides |
23 spectra |
|
0.000 0.000 | 0.000 |
0.421 0.412 | 0.427 |
0.000 0.000 | 0.000 |
0.065 0.046 | 0.080 |
0.162 0.145 | 0.175 |
0.000 0.000 | 0.000 |
0.353 0.347 | 0.357 |
0.000 0.000 | 0.000 |
| 10 spectra, DDNEYWLR | 0.000 | 0.382 | 0.000 | 0.086 | 0.132 | 0.000 | 0.400 | 0.000 | ||
| 2 spectra, LGLTQGSFAFIHK | 0.000 | 0.434 | 0.000 | 0.117 | 0.128 | 0.000 | 0.321 | 0.000 | ||
| 2 spectra, VVQQSVLEVDER | 0.000 | 0.338 | 0.000 | 0.106 | 0.191 | 0.009 | 0.356 | 0.000 | ||
| 4 spectra, LFDEINPETK | 0.000 | 0.447 | 0.000 | 0.075 | 0.124 | 0.000 | 0.354 | 0.000 | ||
| 1 spectrum, EGNFASTFDK | 0.000 | 0.607 | 0.000 | 0.000 | 0.075 | 0.000 | 0.318 | 0.000 | ||
| 3 spectra, YEMHELLK | 0.000 | 0.364 | 0.000 | 0.162 | 0.133 | 0.004 | 0.338 | 0.000 | ||
| 1 spectrum, GLMNHYINK | 0.000 | 0.435 | 0.000 | 0.004 | 0.190 | 0.000 | 0.371 | 0.000 |
| Plot | Mito | Lyso or Perox | ER | Golgi | PM | Cytosol | Nucleus | ||||||
| Expt B |
3 peptides |
5 spectra |
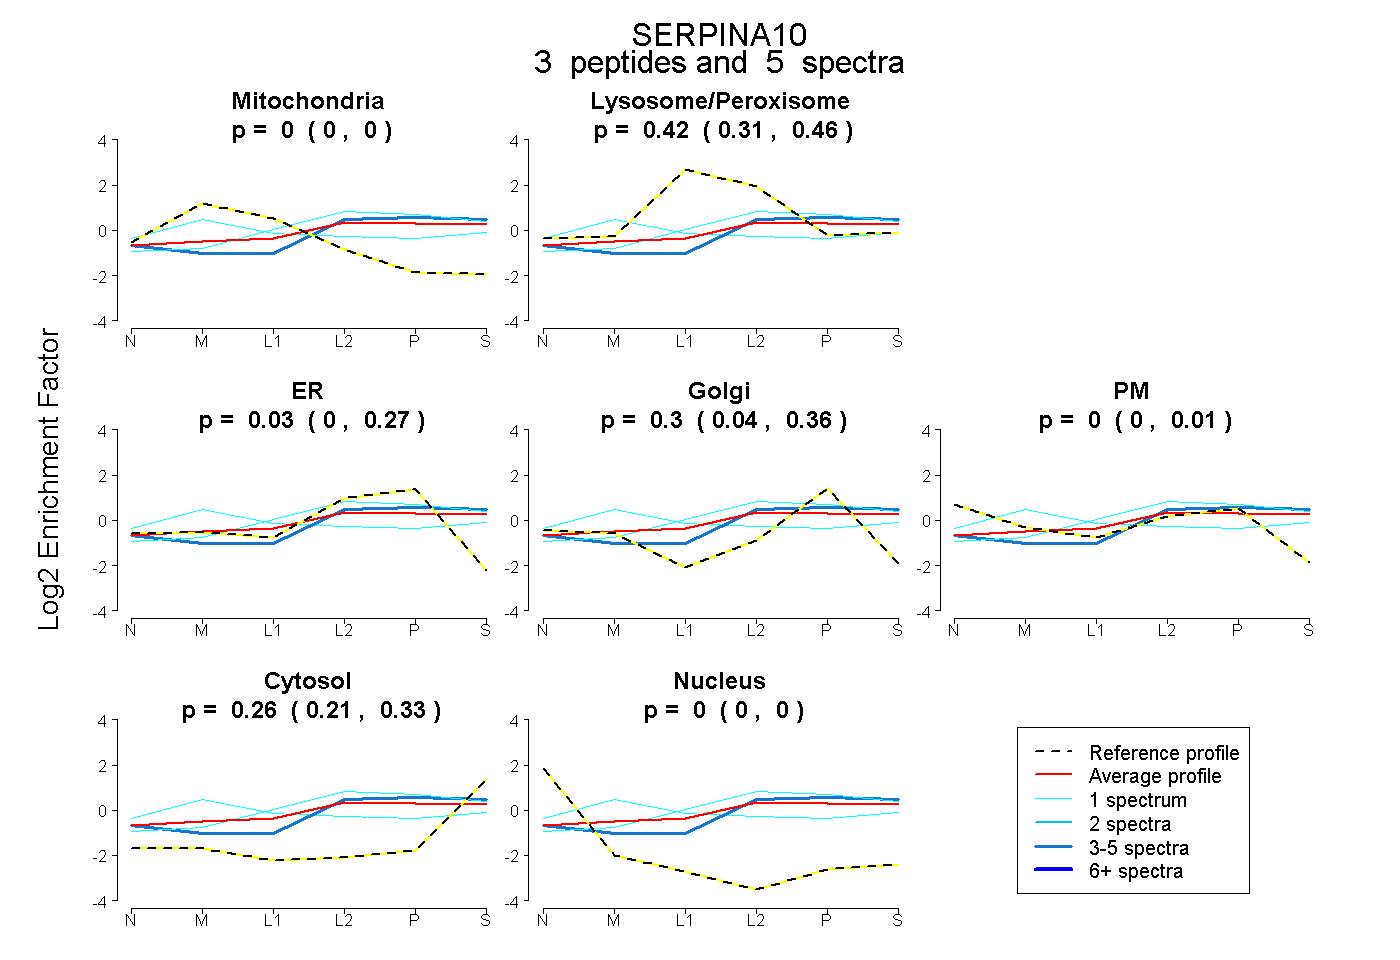 |
0.000 0.000 | 0.000 |
0.416 0.308 | 0.458 |
0.031 0.000 | 0.270 |
0.295 0.039 | 0.359 |
0.000 0.000 | 0.010 |
0.257 0.207 | 0.329 |
0.000 0.000 | 0.000 |
|||
| Plot | Lyso | Other | |||||||||||
| Expt C |
9 peptides |
27 spectra |
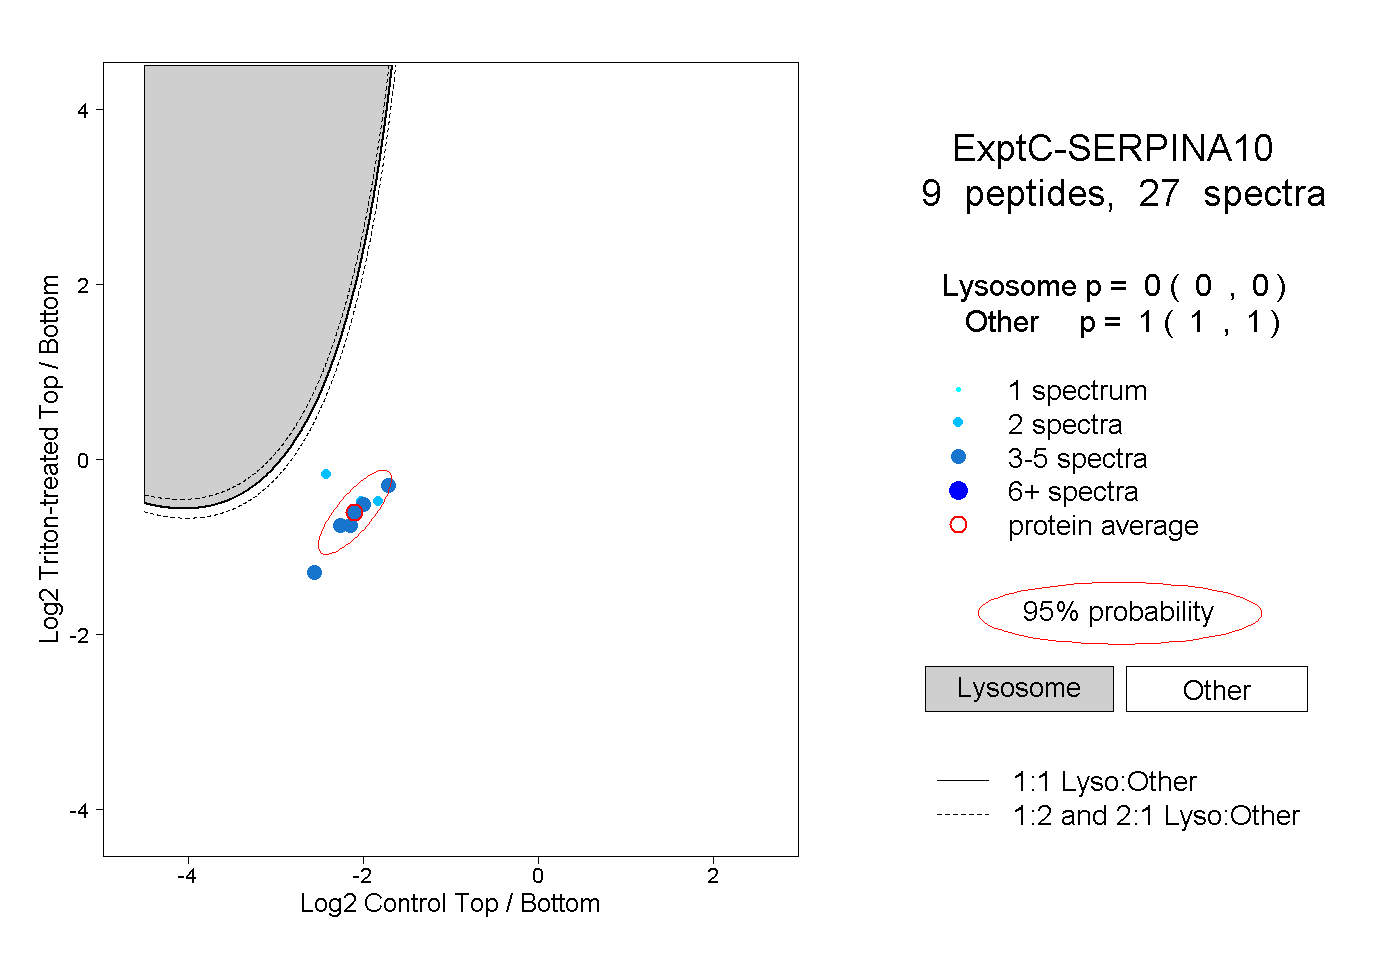 |
0.000 0.000 | 0.000 |
1.000 1.000 | 1.000 |
||||||||
| Plot | Lyso | Other | |||||||||||
| Expt D |
1 peptide |
1 spectrum |
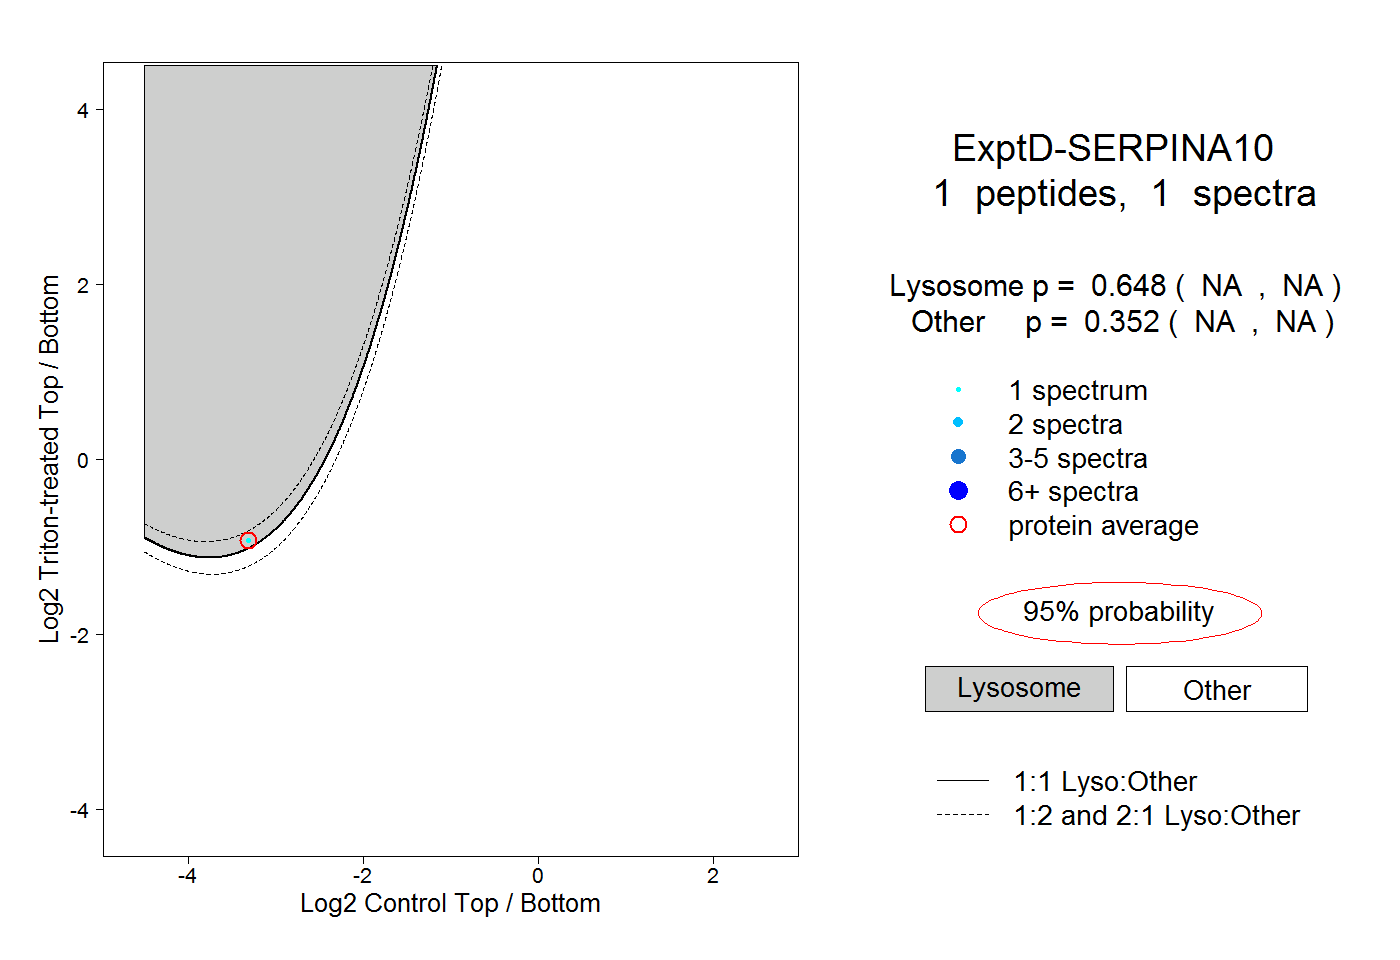 |
0.648 NA | NA |
0.352 NA | NA |