 61
61peptides
spectra
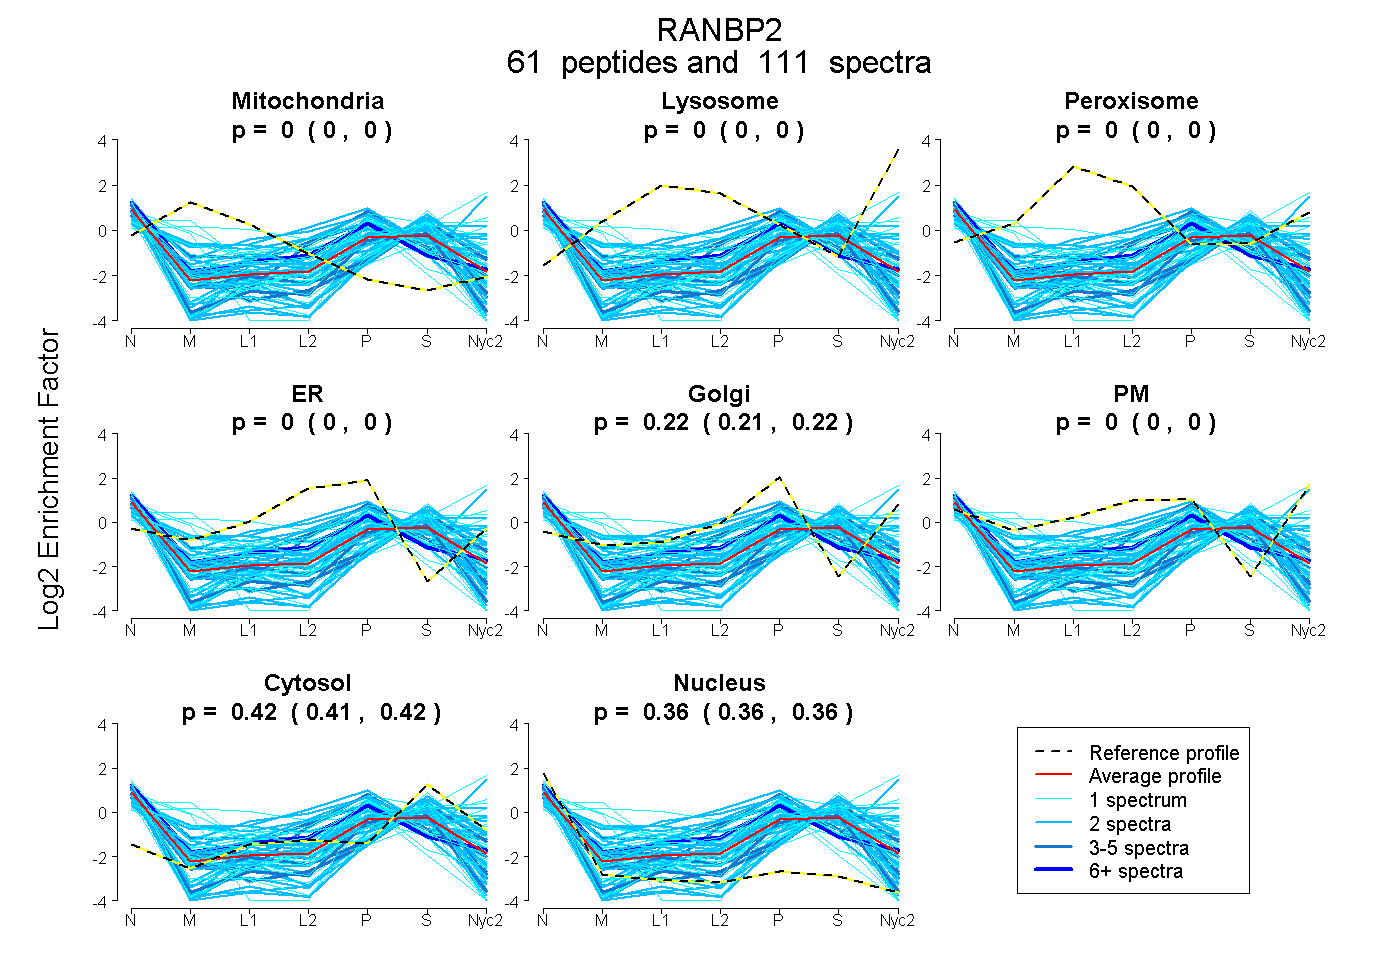
0.000 | 0.000
0.000 | 0.000
0.000 | 0.000
0.000 | 0.004
0.213 | 0.225
0.000 | 0.000
0.413 | 0.419
0.359 | 0.365
7peptides
spectra
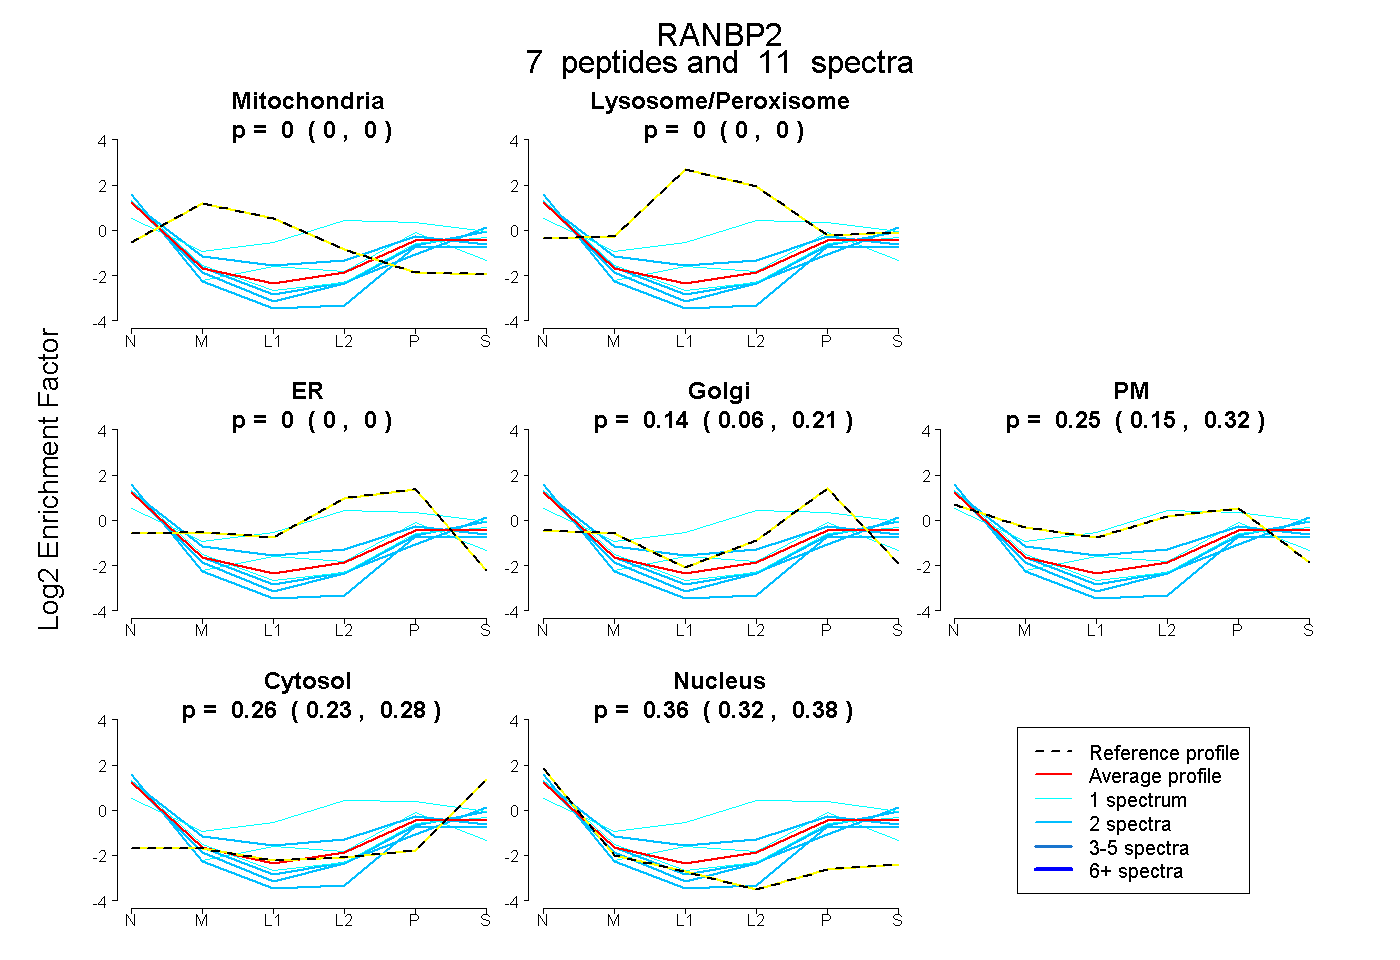
0.000 | 0.000
0.000 | 0.000
0.000 | 0.000
0.061 | 0.211
0.146 | 0.323
0.235 | 0.277
0.324 | 0.385
6peptides
spectra
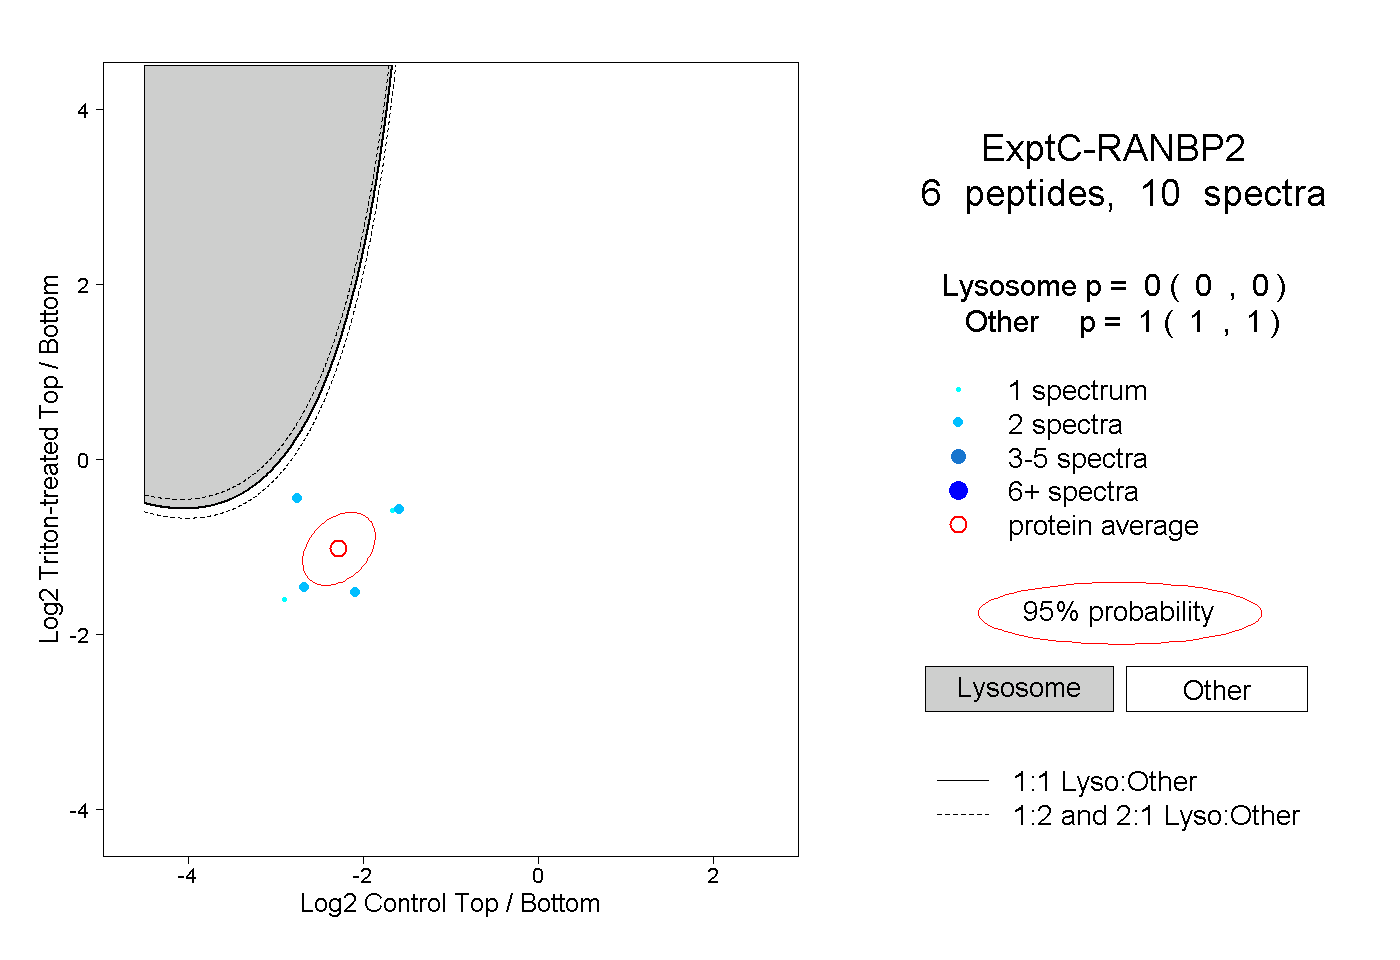
0.000 | 0.000
1.000 | 1.000
1peptide
spectrum
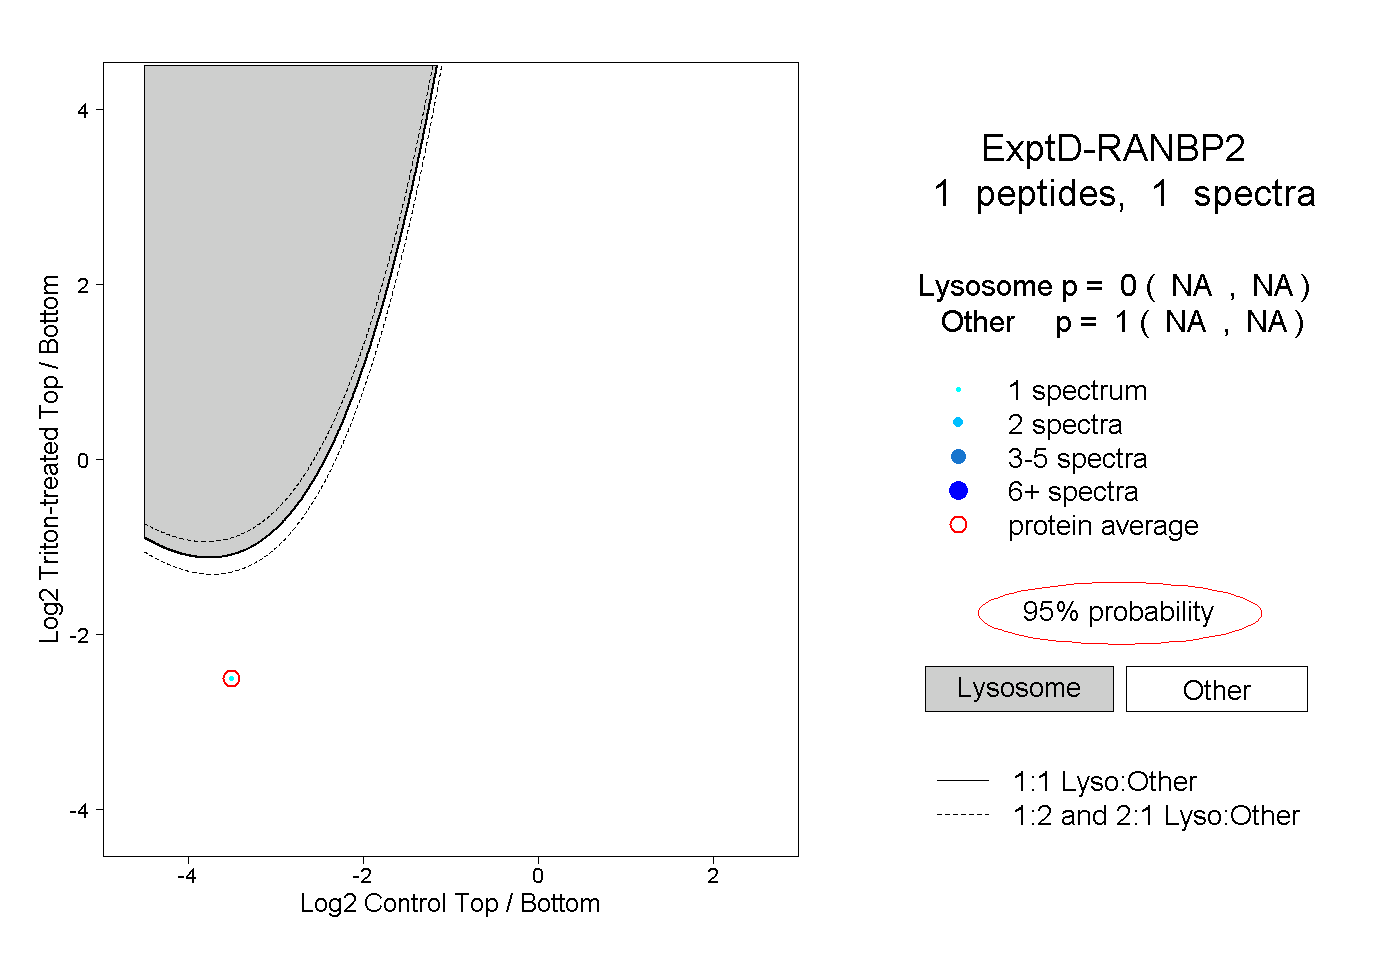
NA | NA
NA | NA