RANBP2
[ENSRNOP00000063941]
Main page
| | | Plot |
Mito |
Lyso |
|
Perox |
ER |
Golgi |
PM |
Cytosol |
Nucleus |
|
| Expt A |
 61
61
peptides |
111
spectra |
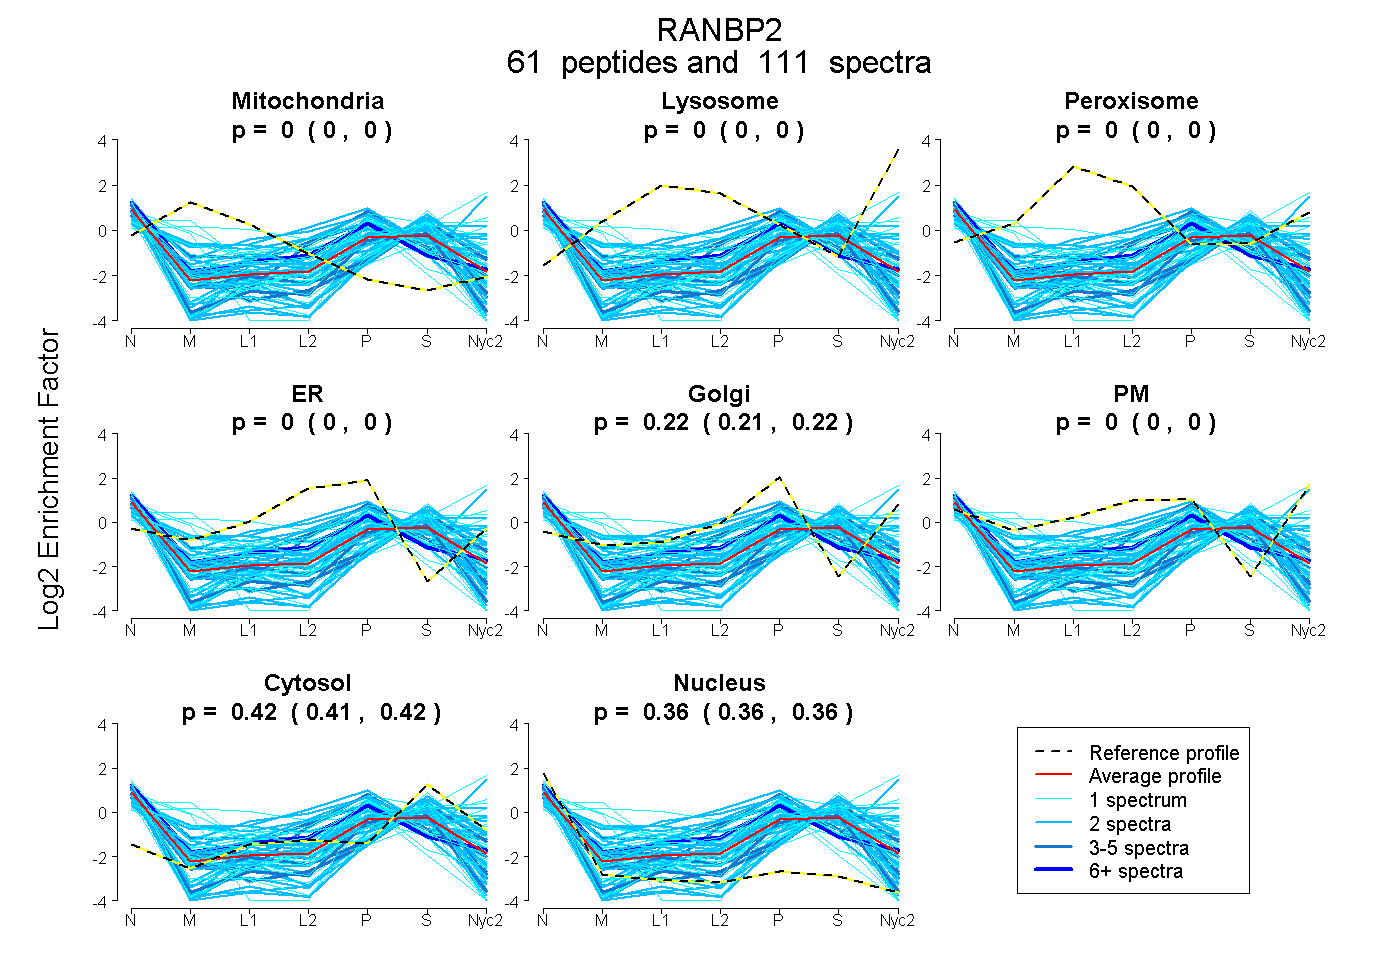 |
0.000
0.000 | 0.000 |
0.000
0.000 | 0.000 |
|
0.000
0.000 | 0.000 |
0.000
0.000 | 0.004 |
0.221
0.213 | 0.225 |
0.000
0.000 | 0.000 |
0.416
0.413 | 0.419 |
0.362
0.359 | 0.365 |
|
| | | Plot |
Mito |
|
Lyso or Perox |
|
ER |
Golgi |
PM |
Cytosol |
Nucleus |
|
| Expt B |
7
peptides |
11
spectra |
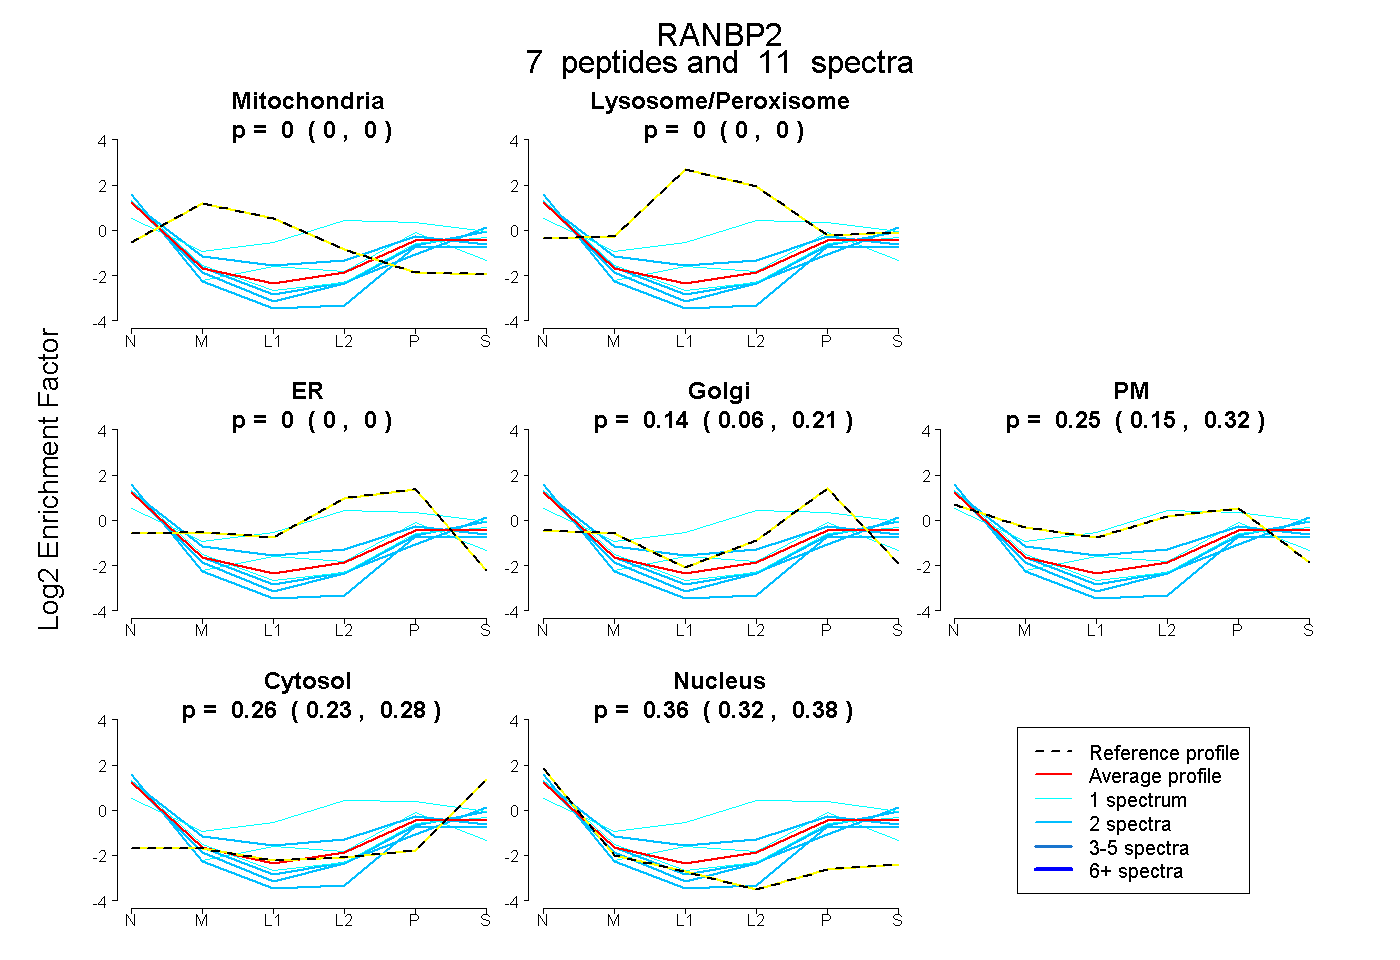 |
0.000
0.000 | 0.000 |
|
0.000
0.000 | 0.000 |
|
0.000
0.000 | 0.000 |
0.140
0.061 | 0.211 |
0.246
0.146 | 0.323 |
0.257
0.235 | 0.277 |
0.357
0.324 | 0.385 |
|
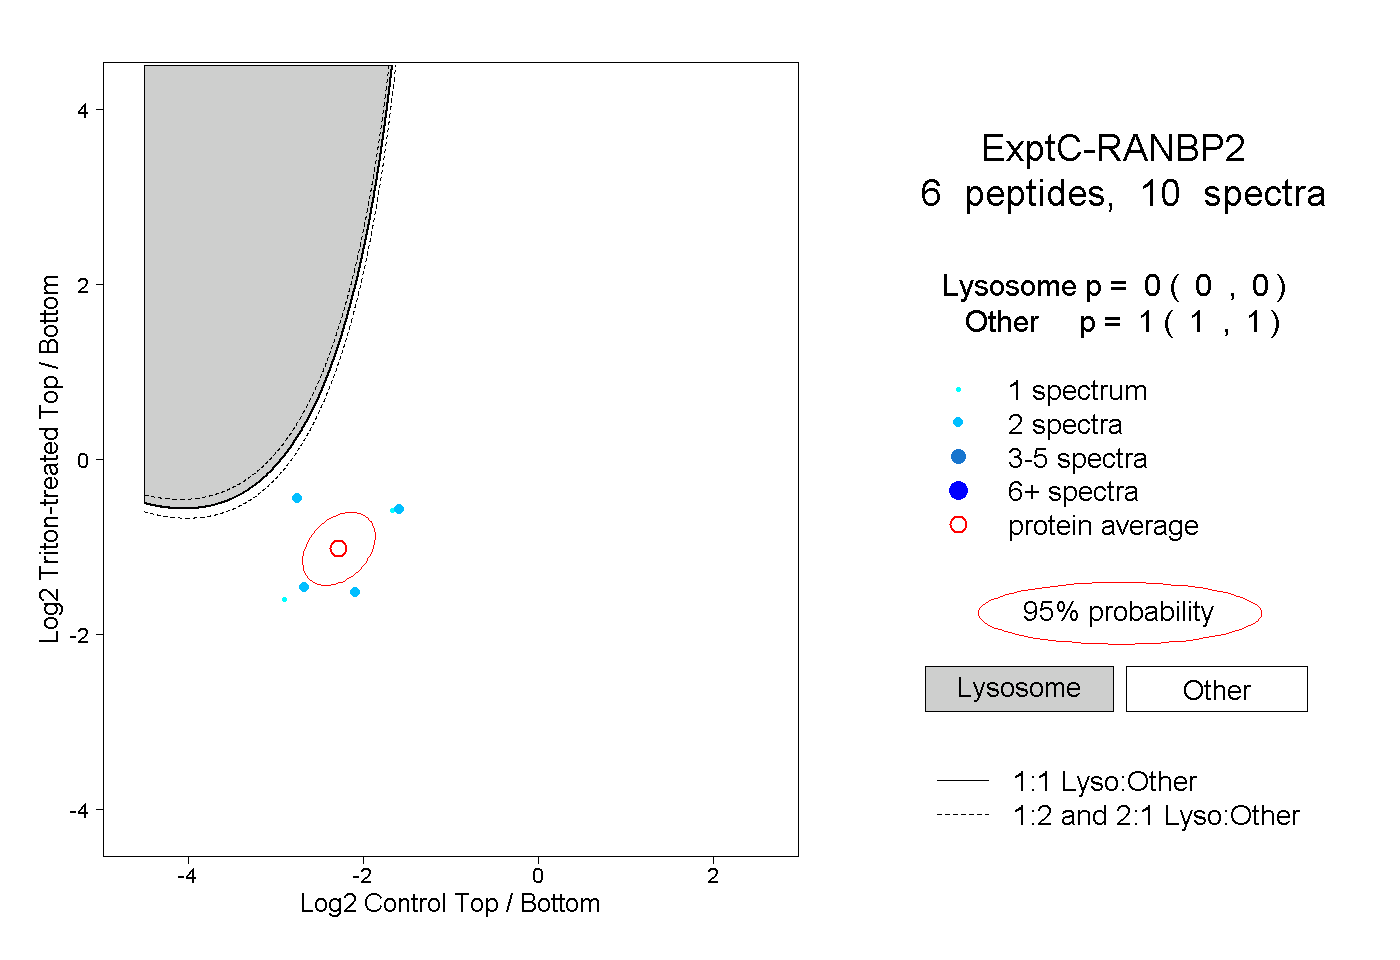
| | | Plot |
|
Lyso |
|
|
|
|
|
|
|
Other |
| Expt C |
6
peptides |
10
spectra |
 |
|
0.000
0.000 | 0.000 |
|
|
|
|
|
|
|
1.000
1.000 | 1.000 |
| 2 spectra, QLCTER |
|
0.000 |
|
|
|
|
|
|
|
1.000 |
| 2 spectra, SGEEDEEVLFK |
|
0.000 |
|
|
|
|
|
|
|
1.000 |
| 2 spectra, NEANAVK |
|
0.000 |
|
|
|
|
|
|
|
1.000 |
| 1 spectrum, EYDLAK |
|
0.000 |
|
|
|
|
|
|
|
1.000 |
| 1 spectrum, SEEPDSDTK |
|
0.000 |
|
|
|
|
|
|
|
1.000 |
| 2 spectra, IAELLCK |
|
0.002 |
|
|
|
|
|
|
|
0.998 |
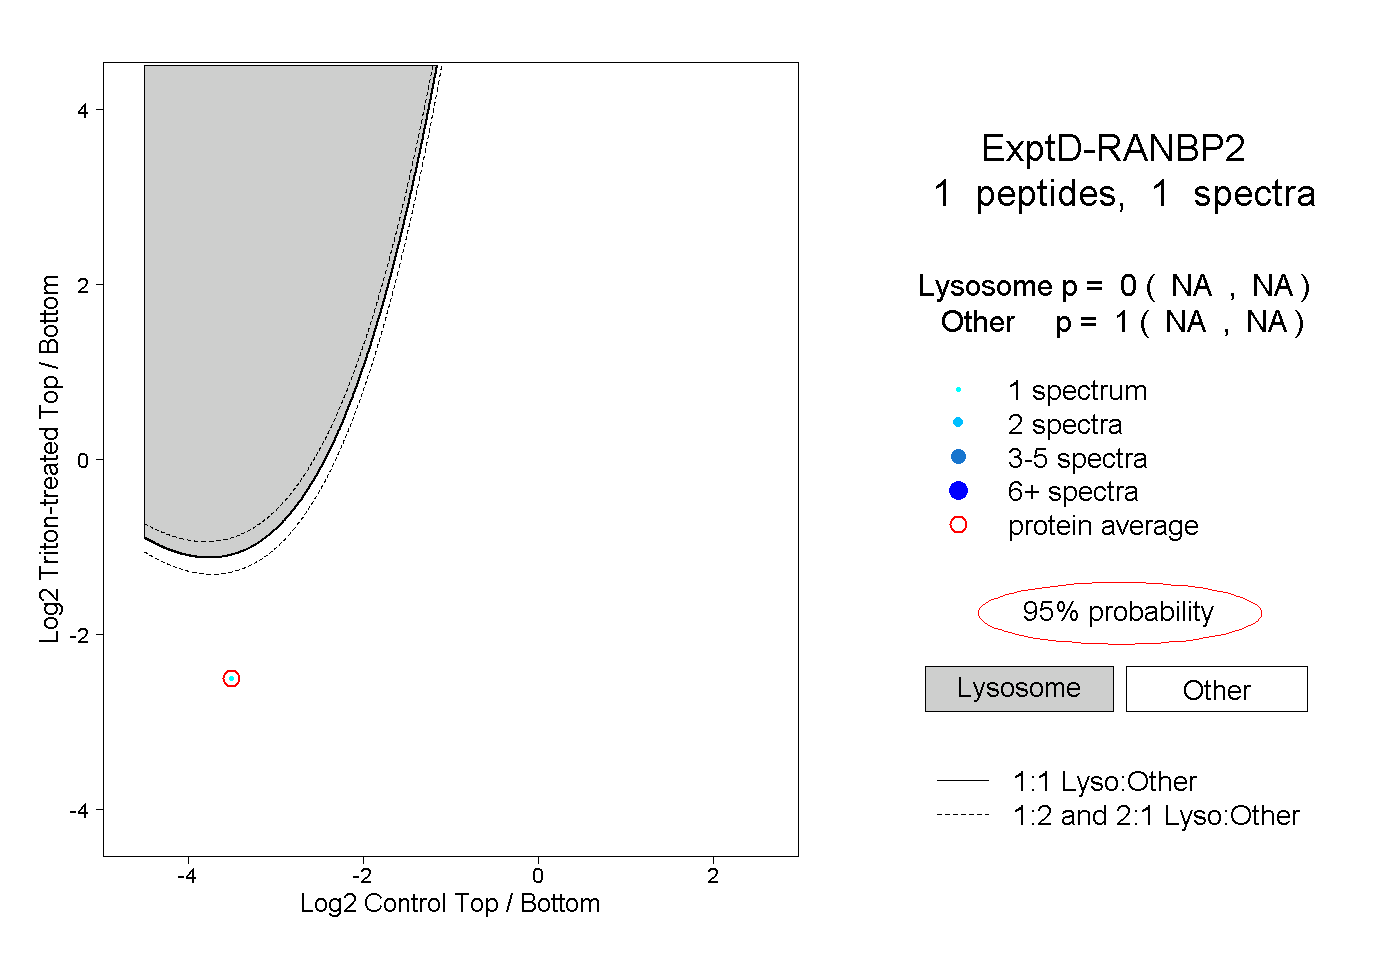
| | | Plot |
|
Lyso |
|
|
|
|
|
|
|
Other |
| Expt D |
1
peptide |
1
spectrum |
 |
|
0.000
NA | NA |
|
|
|
|
|
|
|
1.000
NA | NA |