 6
6peptides
spectra
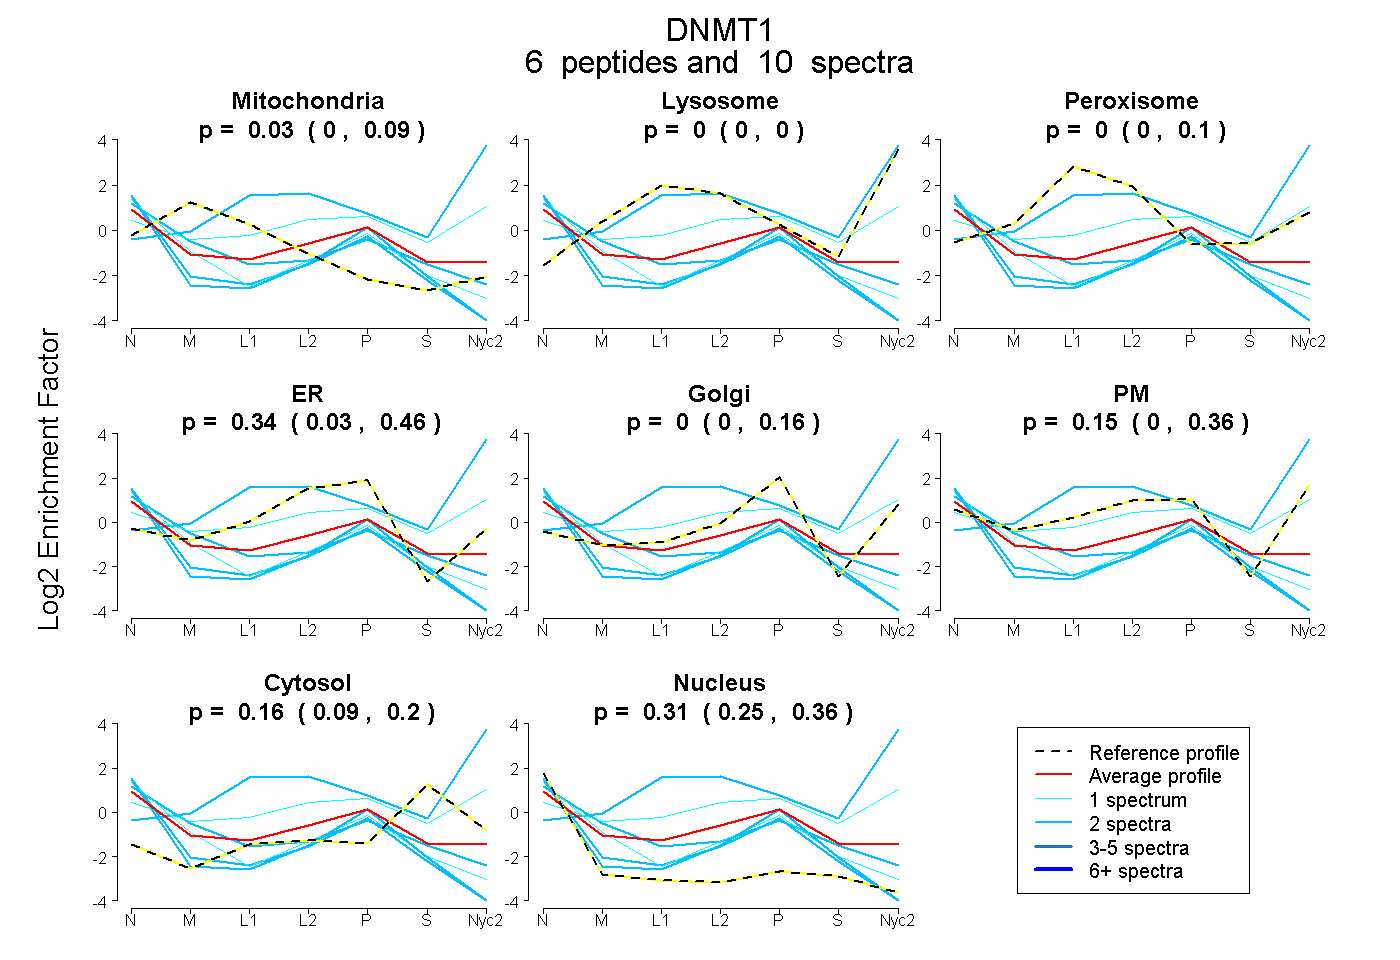
0.000 | 0.090
0.000 | 0.000
0.000 | 0.100
0.030 | 0.462
0.000 | 0.161
0.000 | 0.362
0.086 | 0.196
0.251 | 0.361
1peptide
spectrum
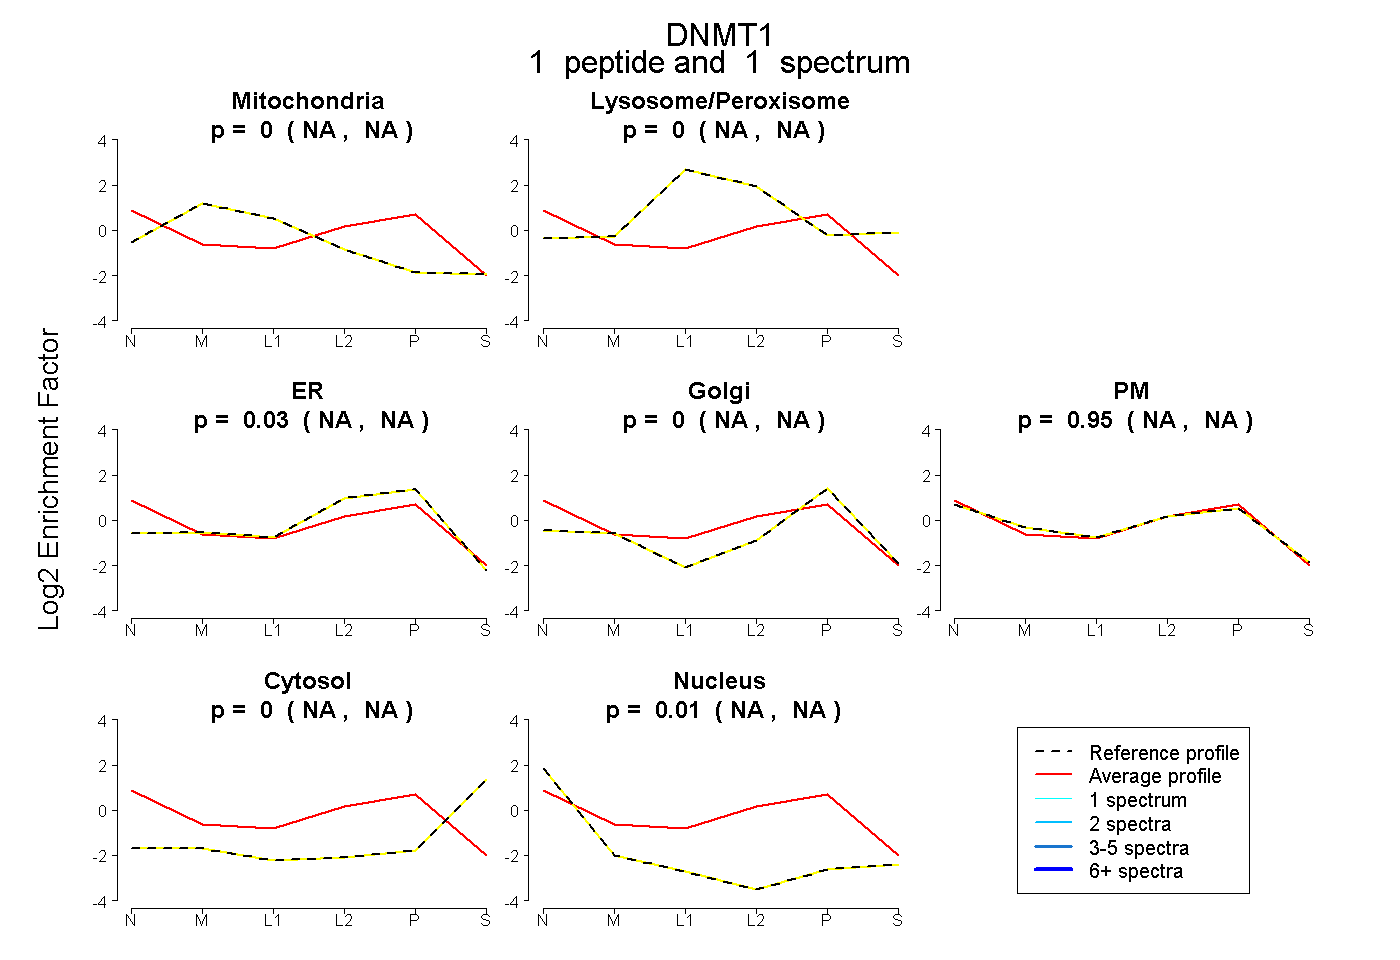
NA | NA
NA | NA
NA | NA
NA | NA
NA | NA
NA | NA
NA | NA
1peptide
spectrum
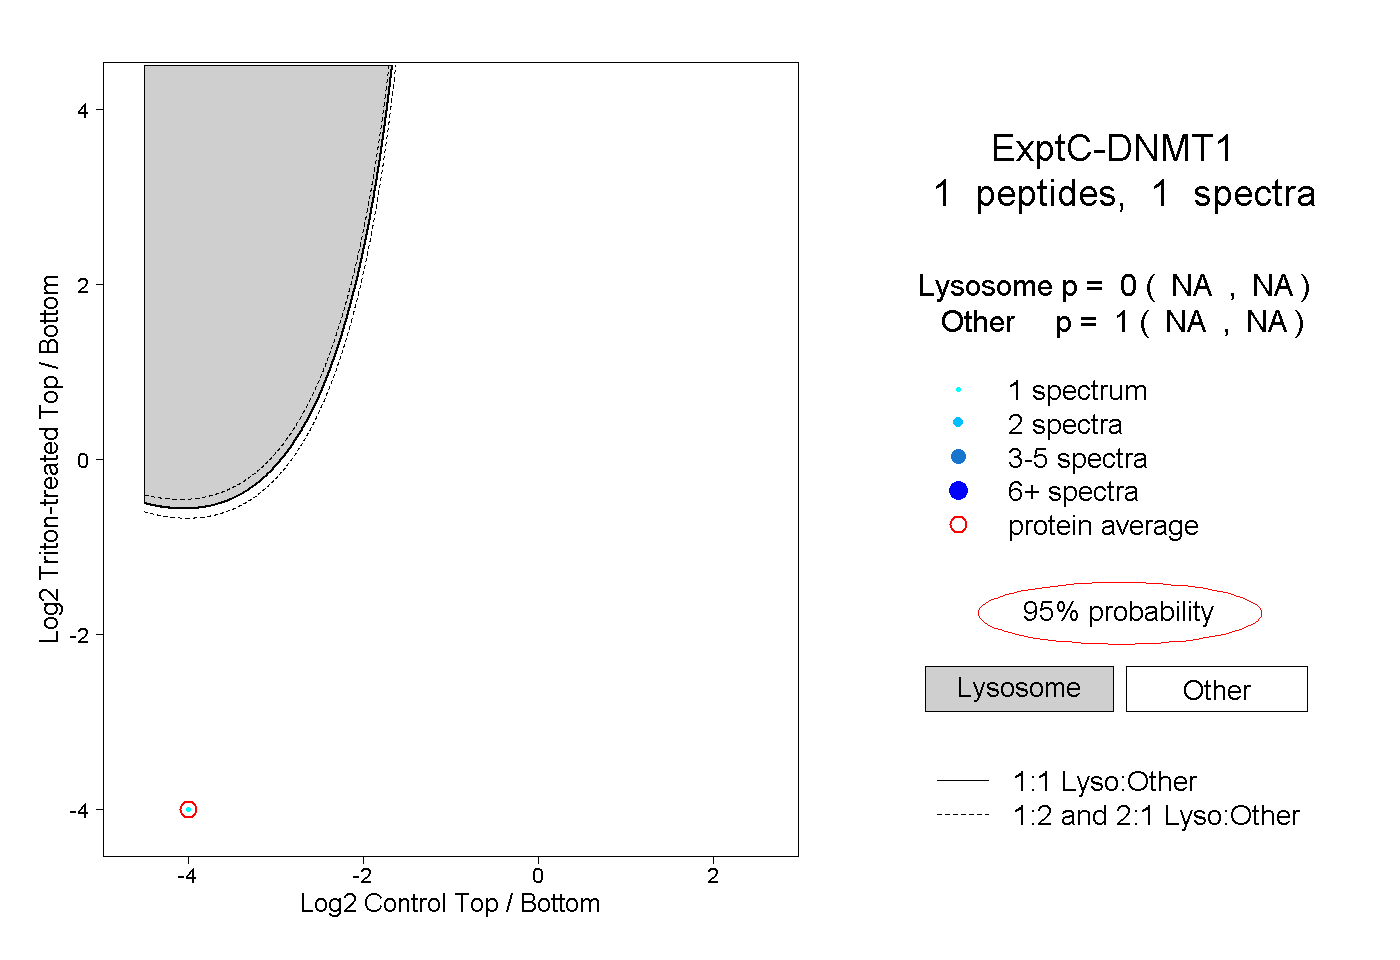
NA | NA
NA | NA