 6
6peptides
spectra
0.000 | 0.090
0.000 | 0.000
0.000 | 0.100
0.030 | 0.462
0.000 | 0.161
0.000 | 0.362
0.086 | 0.196
0.251 | 0.361
| Plot | Mito | Lyso | Perox | ER | Golgi | PM | Cytosol | Nucleus | |||||
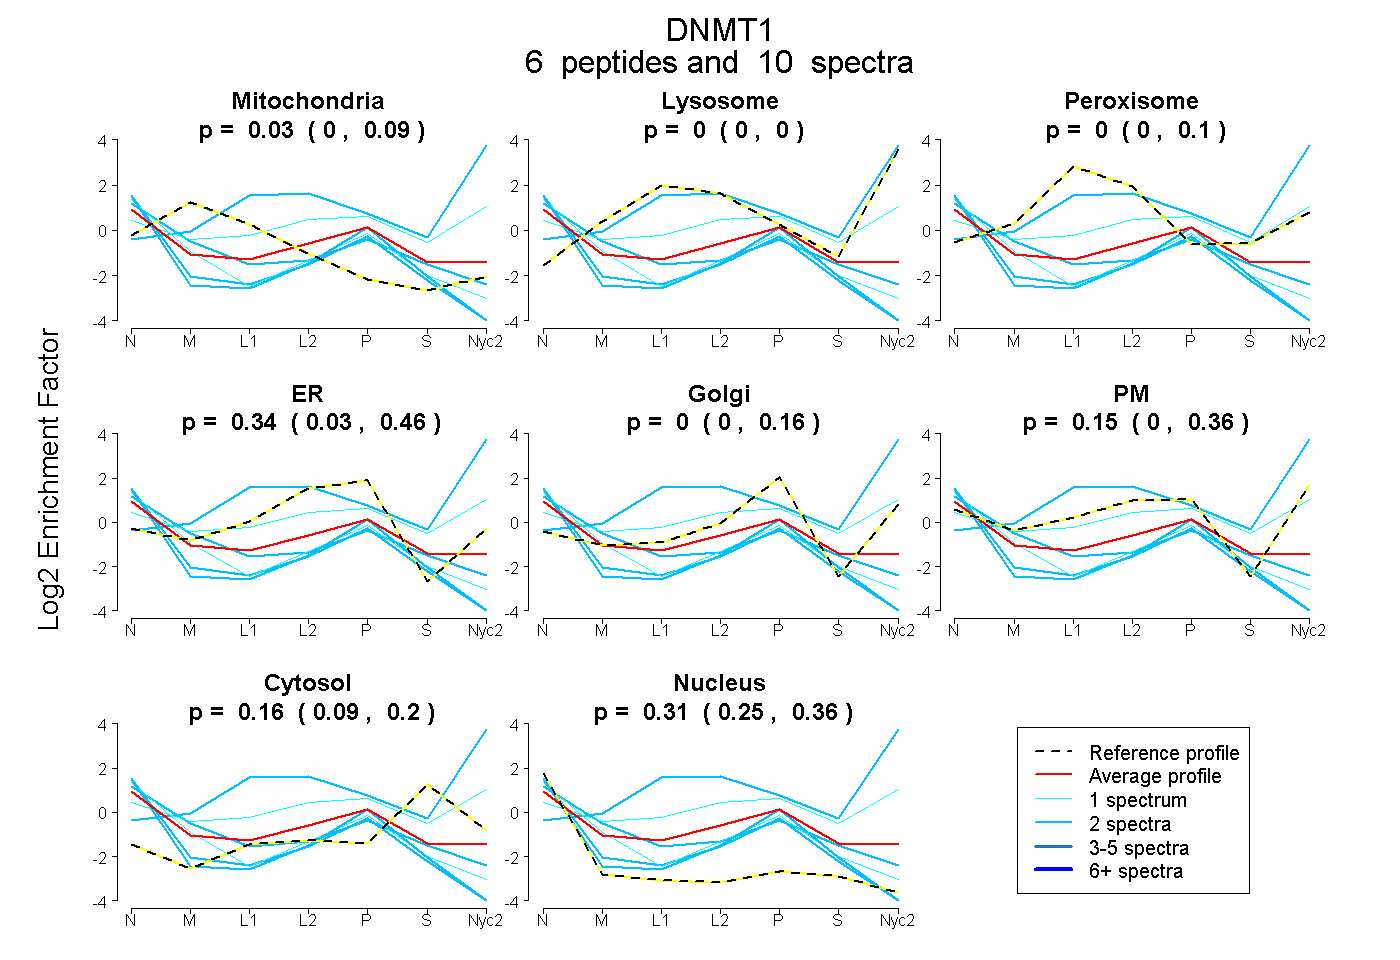
| Expt A |
6 peptides |
10 spectra |
|
0.035 0.000 | 0.090 |
0.000 0.000 | 0.000 |
0.000 0.000 | 0.100 |
0.341 0.030 | 0.462 |
0.000 0.000 | 0.161 |
0.154 0.000 | 0.362 |
0.165 0.086 | 0.196 |
0.306 0.251 | 0.361 |
| 2 spectra, GSNLDAPEPYR | 0.233 | 0.000 | 0.000 | 0.237 | 0.059 | 0.000 | 0.096 | 0.374 | ||
| 2 spectra, FFLLENVR | 0.000 | 0.000 | 0.000 | 0.299 | 0.000 | 0.000 | 0.000 | 0.701 | ||
| 2 spectra, VLEQLEEVDGR | 0.000 | 0.000 | 0.000 | 0.310 | 0.000 | 0.000 | 0.000 | 0.690 | ||
| 1 spectrum, NFVSFR | 0.000 | 0.000 | 0.083 | 0.000 | 0.000 | 0.647 | 0.270 | 0.000 | ||
| 2 spectra, ELASR | 0.000 | 0.830 | 0.000 | 0.000 | 0.000 | 0.150 | 0.021 | 0.000 | ||
| 1 spectrum, LPLFPEPLHVFAPR | 0.039 | 0.000 | 0.000 | 0.379 | 0.000 | 0.000 | 0.000 | 0.582 |
| Plot | Mito | Lyso or Perox | ER | Golgi | PM | Cytosol | Nucleus | ||||||
| Expt B |
1 peptide |
1 spectrum |
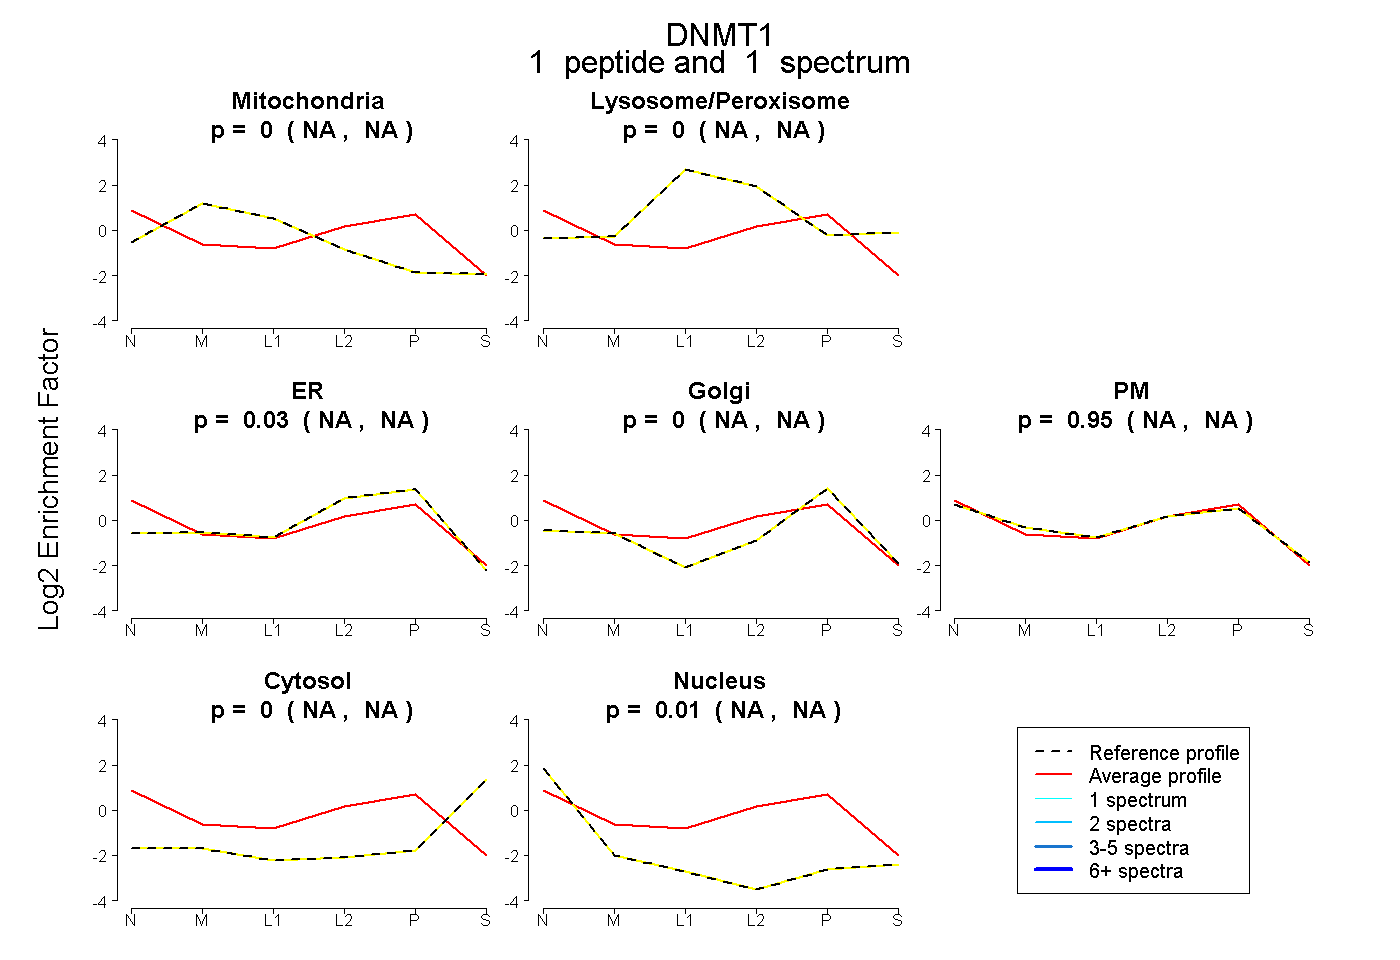 |
0.000 NA | NA |
0.000 NA | NA |
0.033 NA | NA |
0.000 NA | NA |
0.954 NA | NA |
0.000 NA | NA |
0.014 NA | NA |
|||
| Plot | Lyso | Other | |||||||||||
| Expt C |
1 peptide |
1 spectrum |
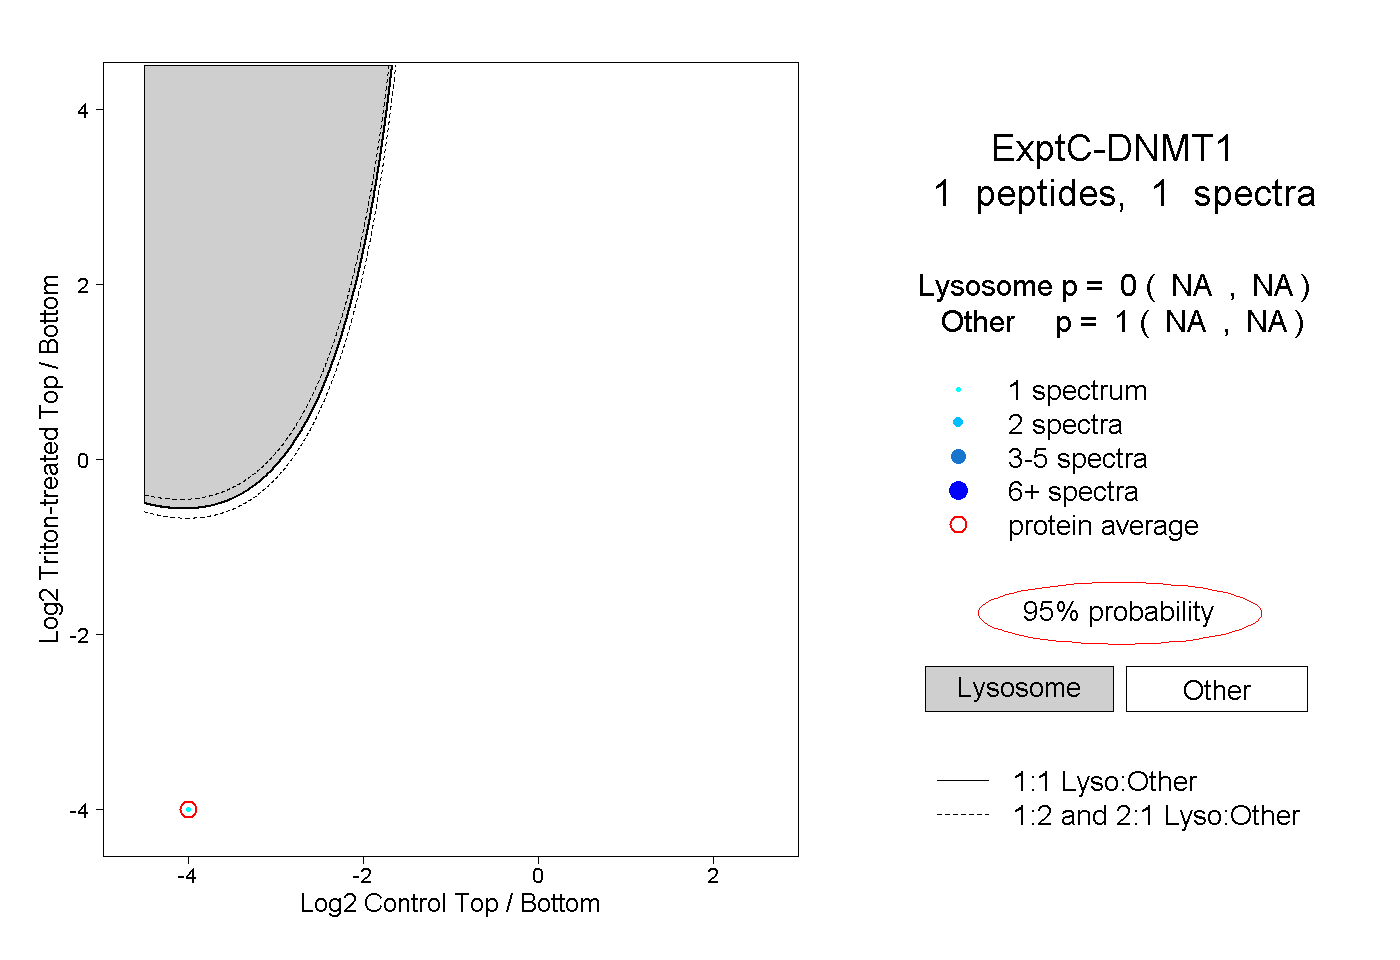 |
0.000 NA | NA |
1.000 NA | NA |