 6
6peptides
spectra
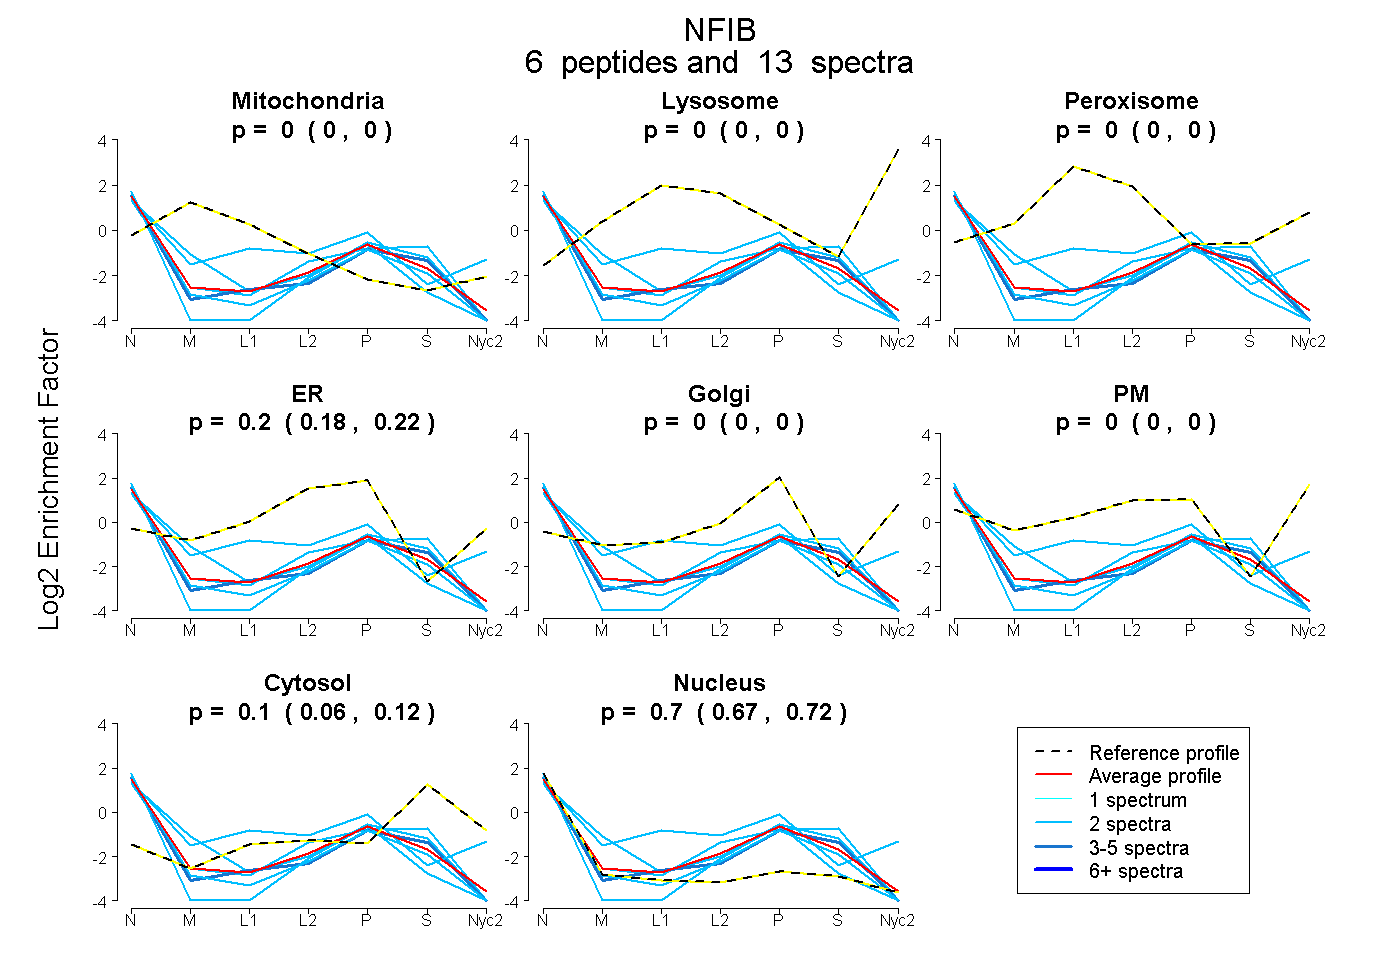
0.000 | 0.000
0.000 | 0.000
0.000 | 0.000
0.178 | 0.222
0.000 | 0.000
0.000 | 0.000
0.065 | 0.124
0.674 | 0.721
1peptide
spectrum
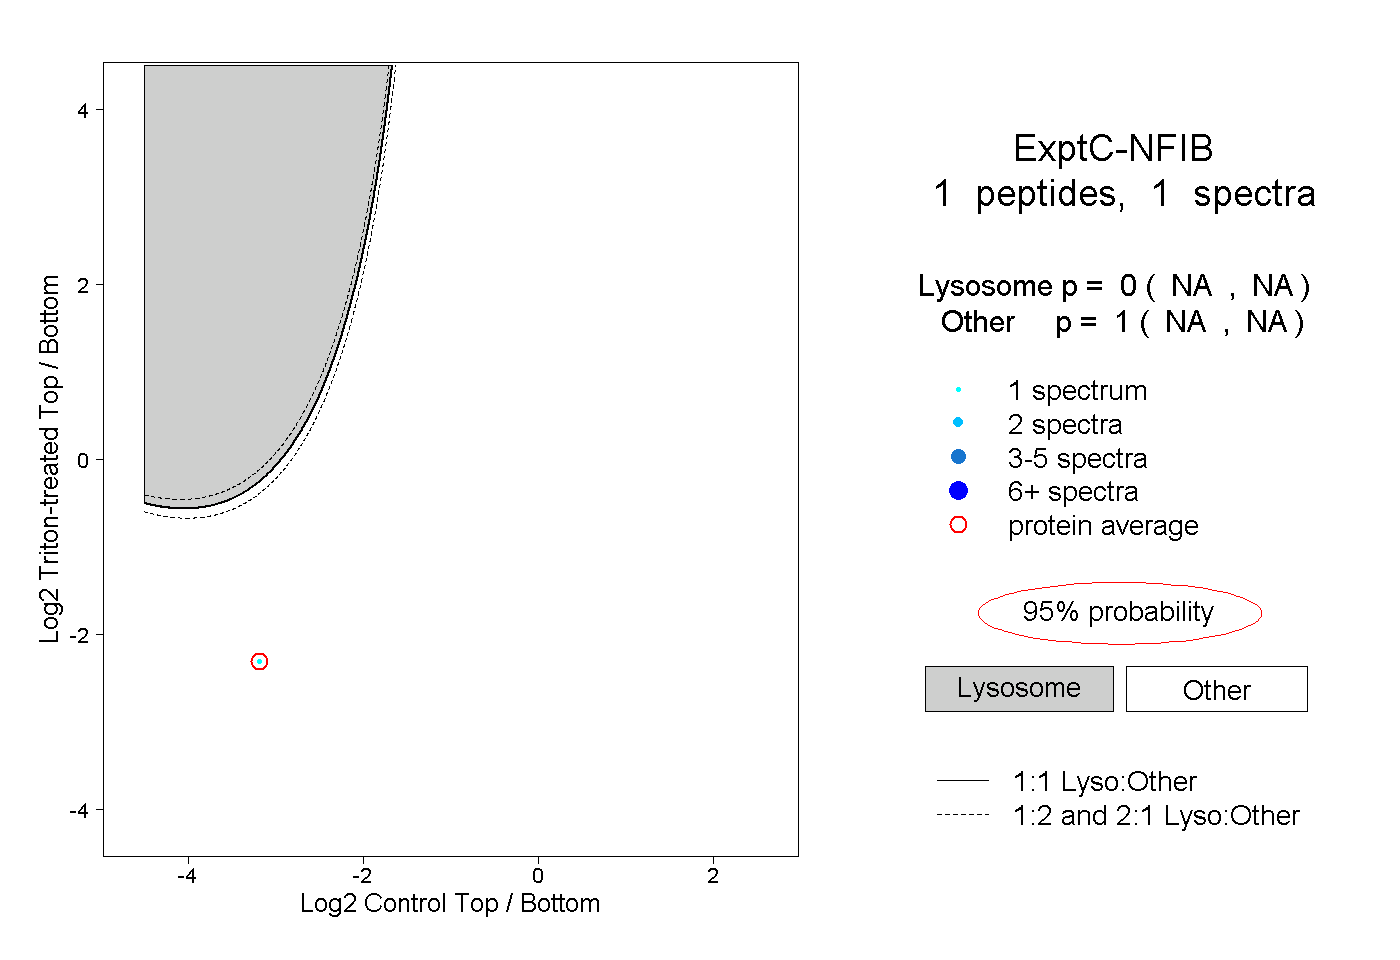
NA | NA
NA | NA
1peptide
spectra
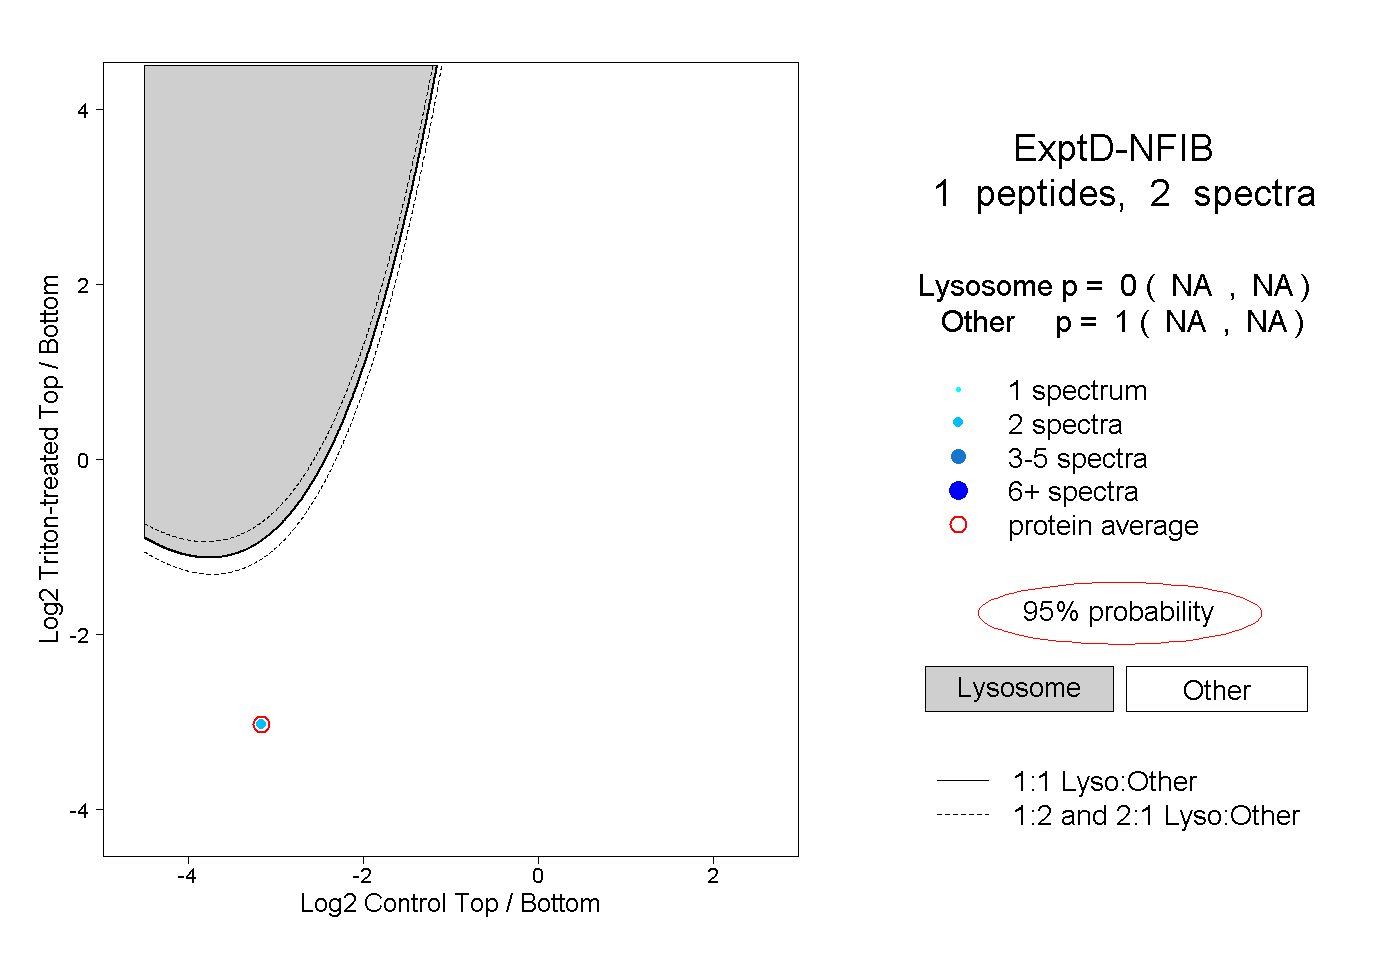
NA | NA
NA | NA