 6
6peptides
spectra
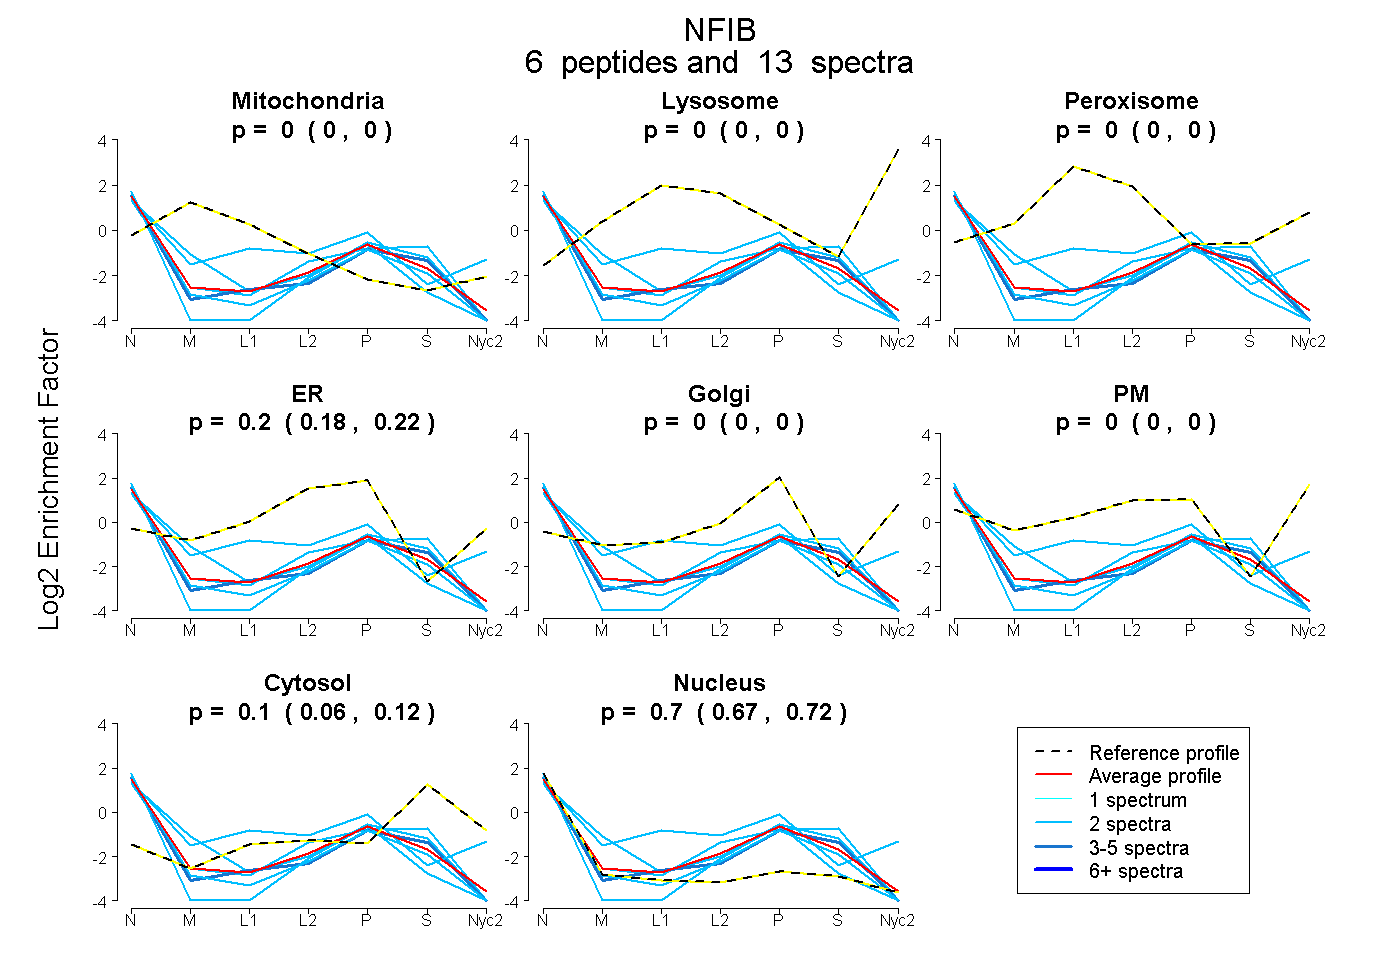
0.000 | 0.000
0.000 | 0.000
0.000 | 0.000
0.178 | 0.222
0.000 | 0.000
0.000 | 0.000
0.065 | 0.124
0.674 | 0.721
| Plot | Mito | Lyso | Perox | ER | Golgi | PM | Cytosol | Nucleus | |||||
| Expt A |
6 peptides |
13 spectra |
|
0.000 0.000 | 0.000 |
0.000 0.000 | 0.000 |
0.000 0.000 | 0.000 |
0.202 0.178 | 0.222 |
0.000 0.000 | 0.000 |
0.000 0.000 | 0.000 |
0.099 0.065 | 0.124 |
0.699 0.674 | 0.721 |
| 2 spectra, LDLVMVILFK | 0.000 | 0.000 | 0.044 | 0.199 | 0.004 | 0.306 | 0.000 | 0.446 | ||
| 2 spectra, EDFVLTVTGK | 0.000 | 0.000 | 0.000 | 0.123 | 0.000 | 0.000 | 0.253 | 0.624 | ||
| 2 spectra, NPPGYLEDSFVK | 0.000 | 0.000 | 0.000 | 0.102 | 0.007 | 0.000 | 0.000 | 0.890 | ||
| 2 spectra, SGVFNVSELVR | 0.000 | 0.000 | 0.000 | 0.125 | 0.000 | 0.000 | 0.059 | 0.816 | ||
| 3 spectra, GIPLESTDGER | 0.000 | 0.000 | 0.000 | 0.088 | 0.000 | 0.000 | 0.170 | 0.742 | ||
| 2 spectra, DELLSEKPEIK | 0.067 | 0.000 | 0.000 | 0.173 | 0.000 | 0.000 | 0.125 | 0.634 |
| Plot | Lyso | Other | |||||||||||
| Expt C |
1 peptide |
1 spectrum |
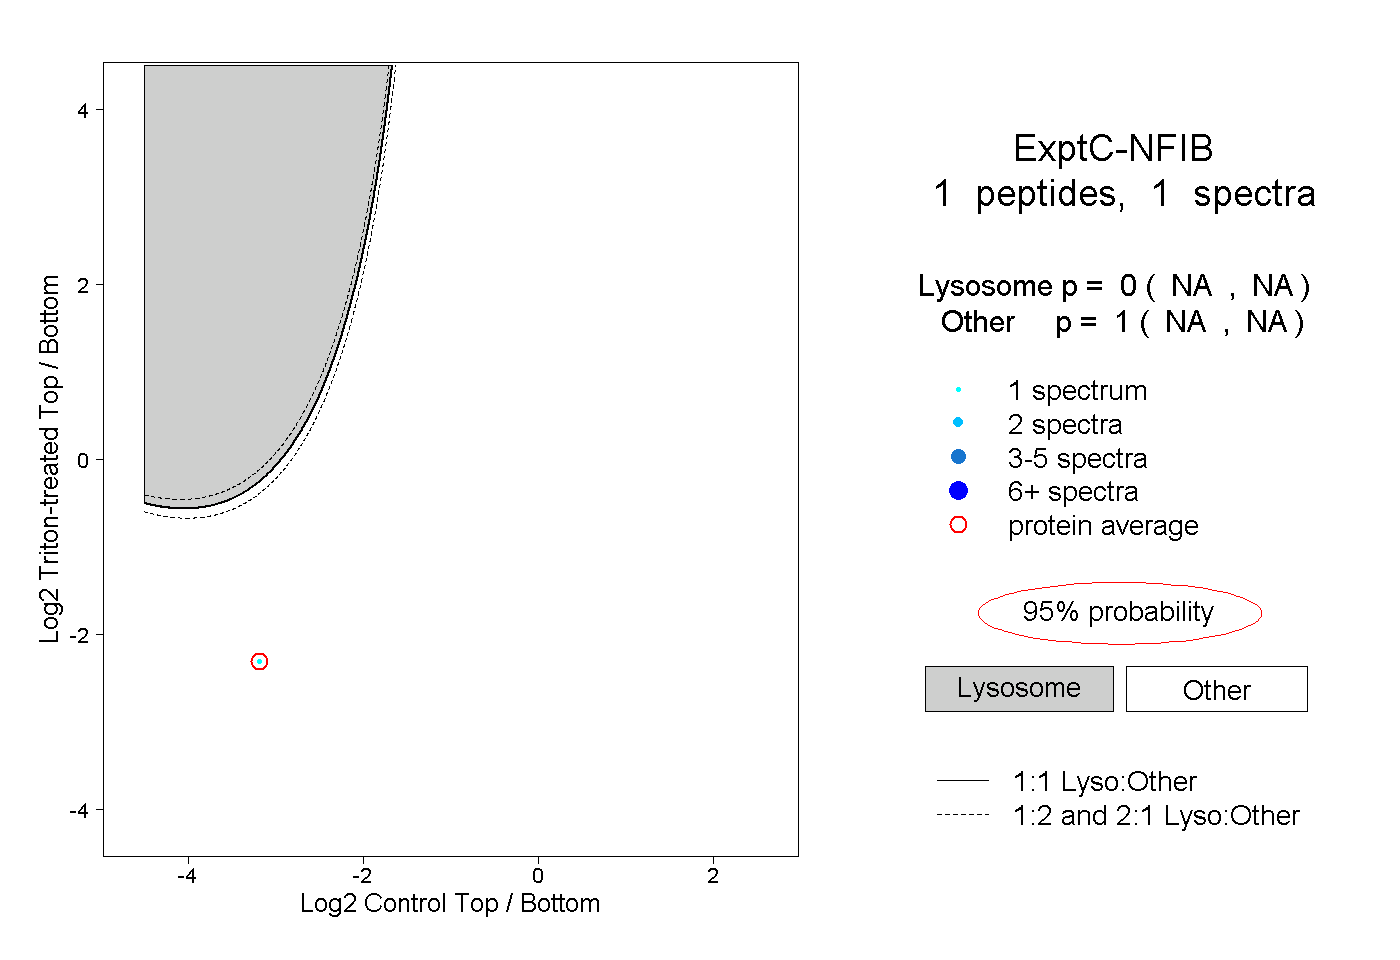 |
0.000 NA | NA |
1.000 NA | NA |
||||||||
| Plot | Lyso | Other | |||||||||||
| Expt D |
1 peptide |
2 spectra |
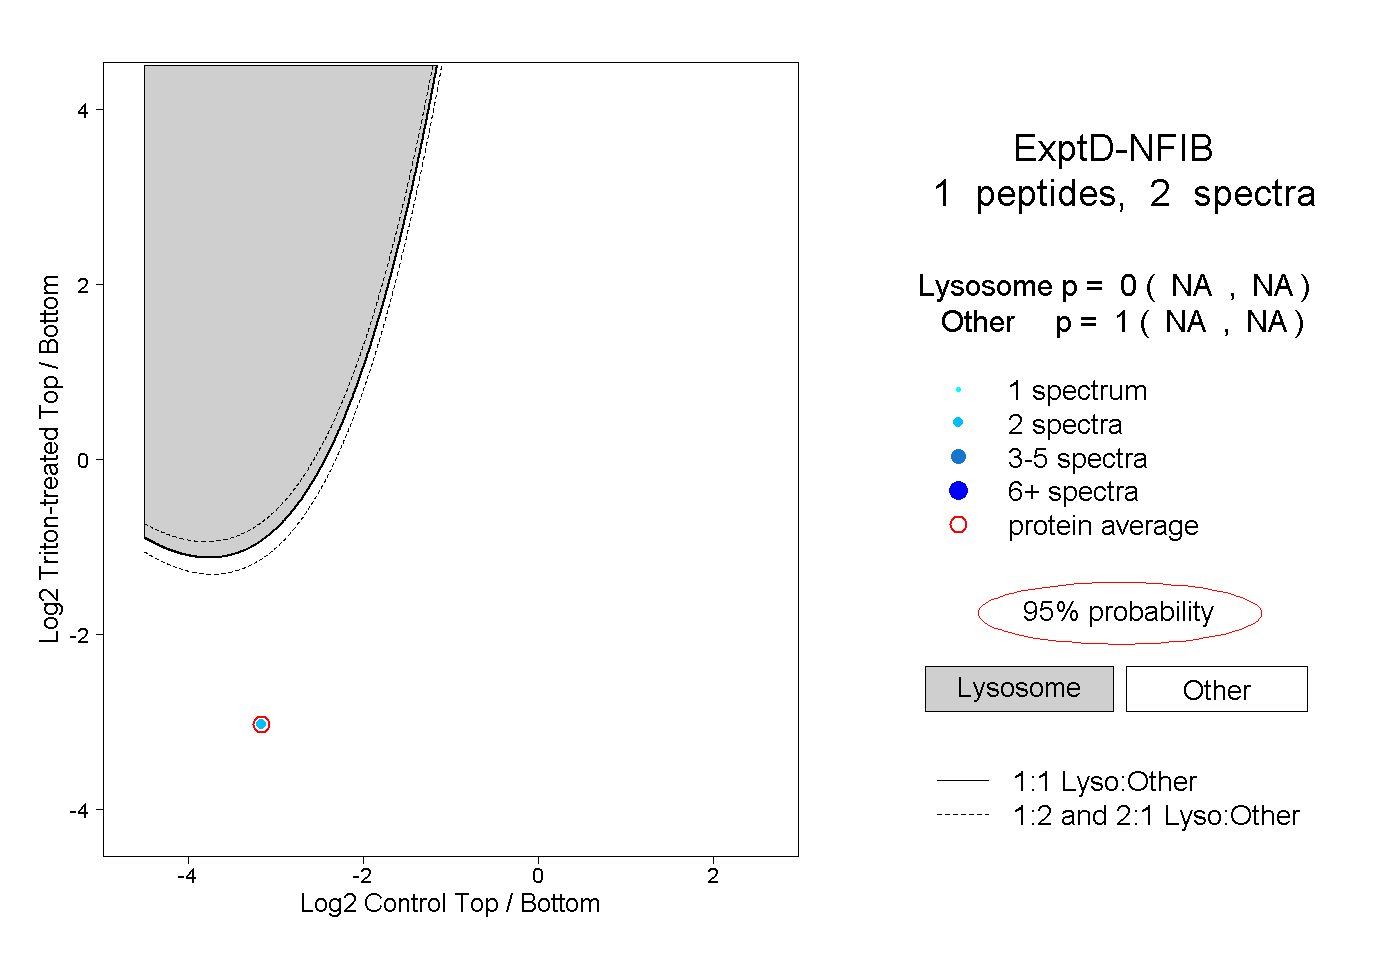 |
0.000 NA | NA |
1.000 NA | NA |