 23
23peptides
spectra
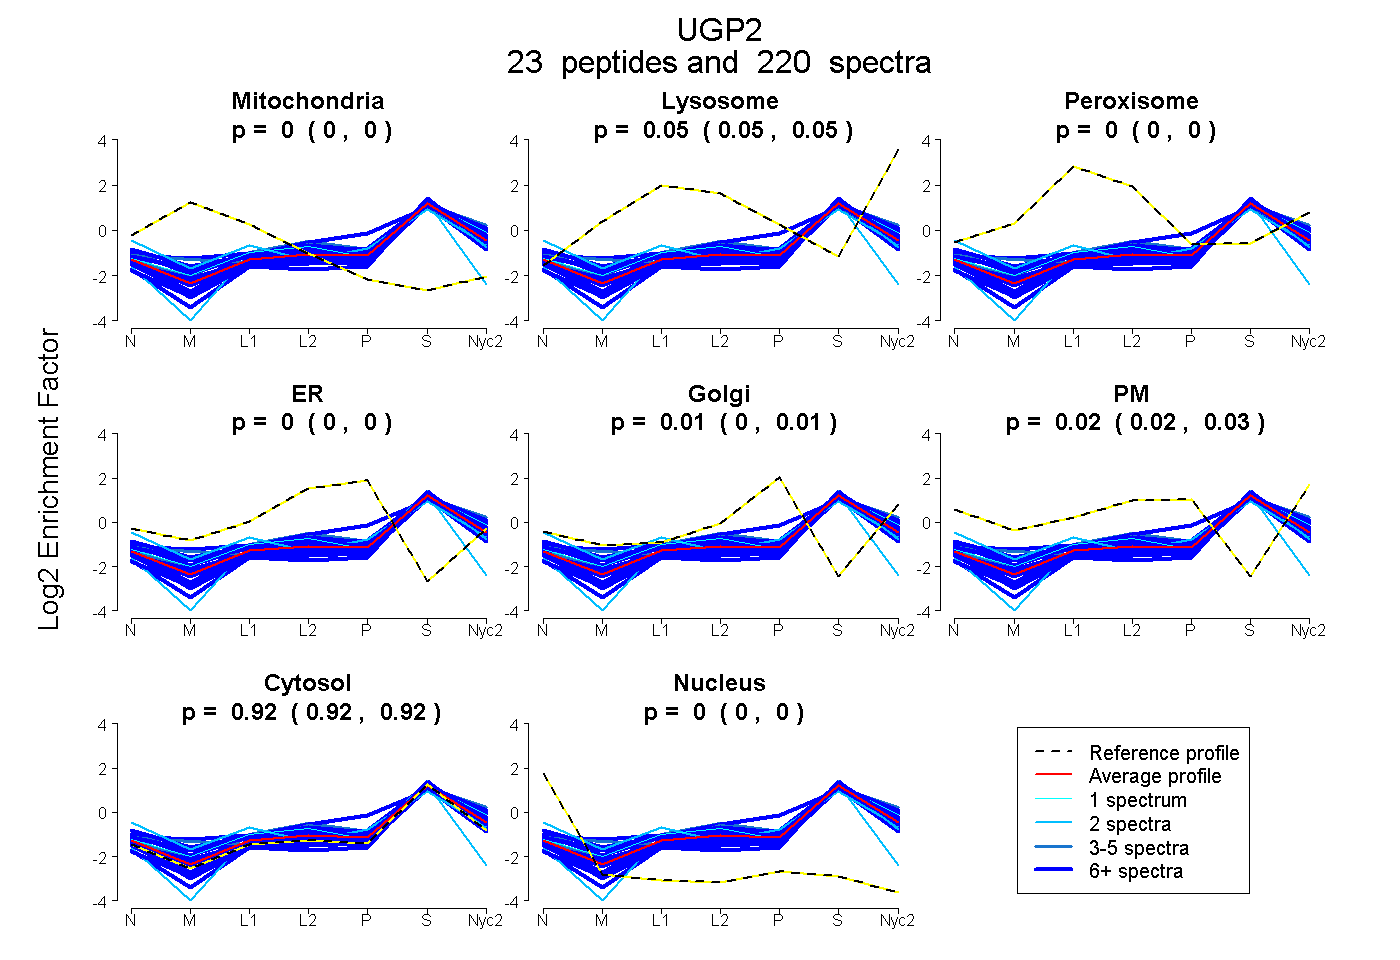
0.000 | 0.000
0.046 | 0.051
0.000 | 0.000
0.000 | 0.000
0.001 | 0.010
0.016 | 0.026
0.922 | 0.925
0.000 | 0.000
18peptides
spectra
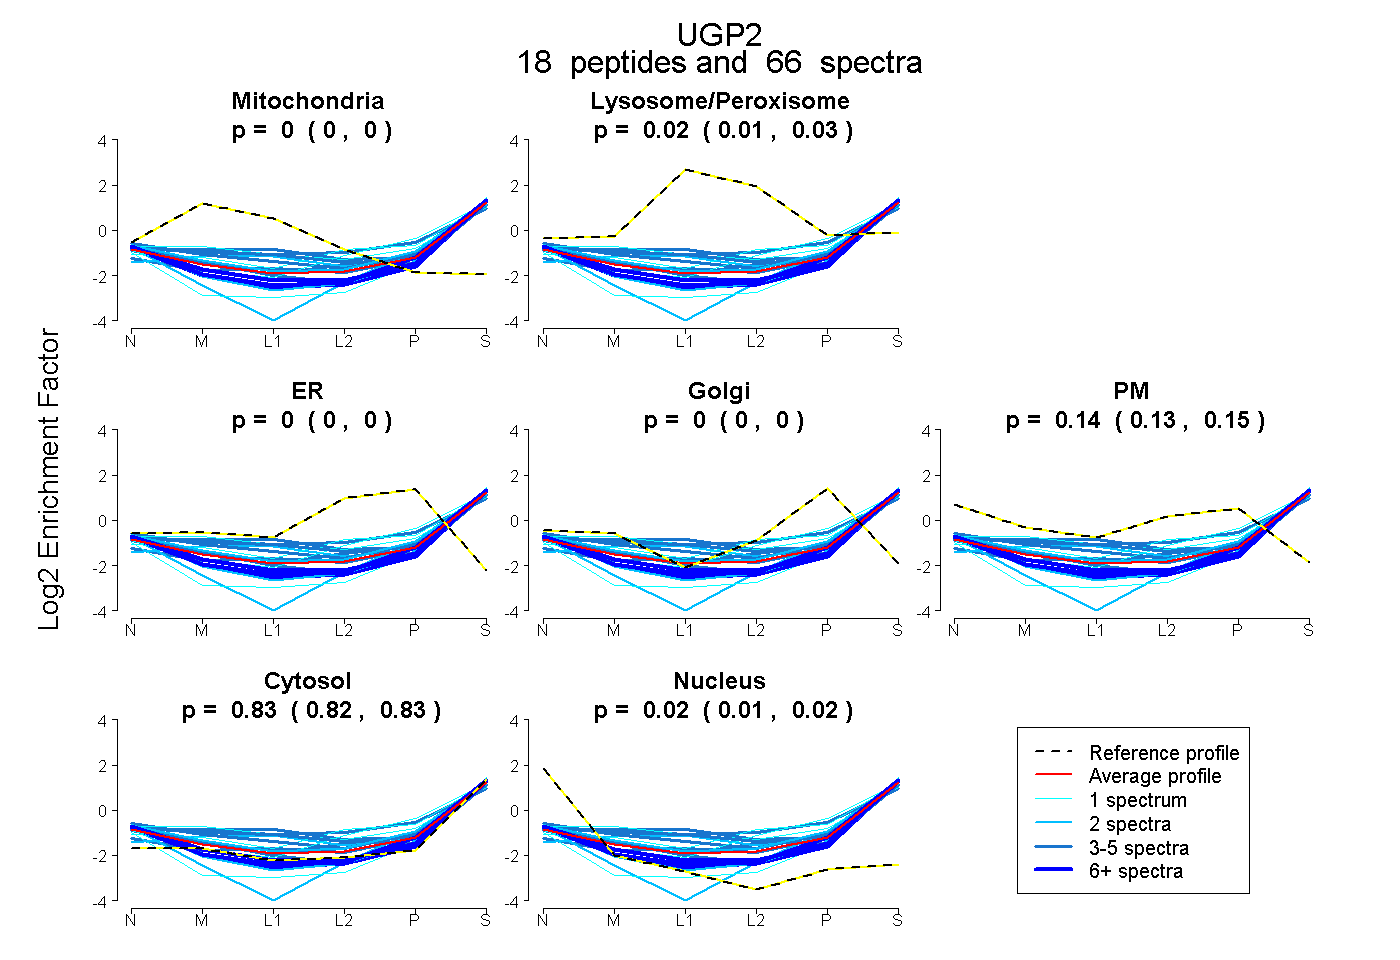
0.000 | 0.000
0.006 | 0.027
0.000 | 0.000
0.000 | 0.000
0.128 | 0.151
0.821 | 0.830
0.010 | 0.022
23peptides
spectra
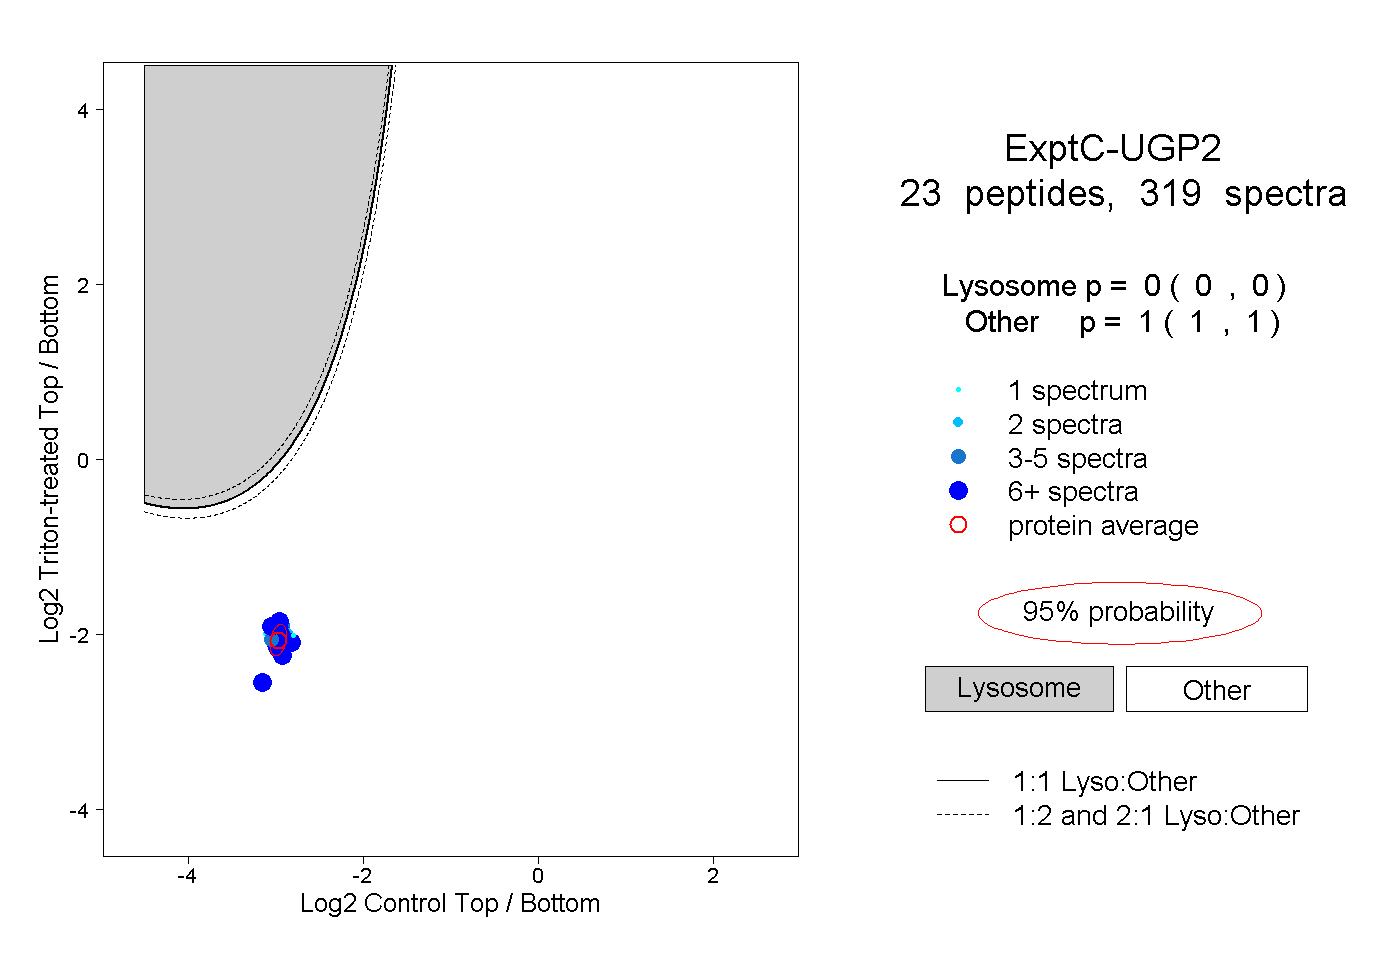
0.000 | 0.000
1.000 | 1.000
10peptides
spectra
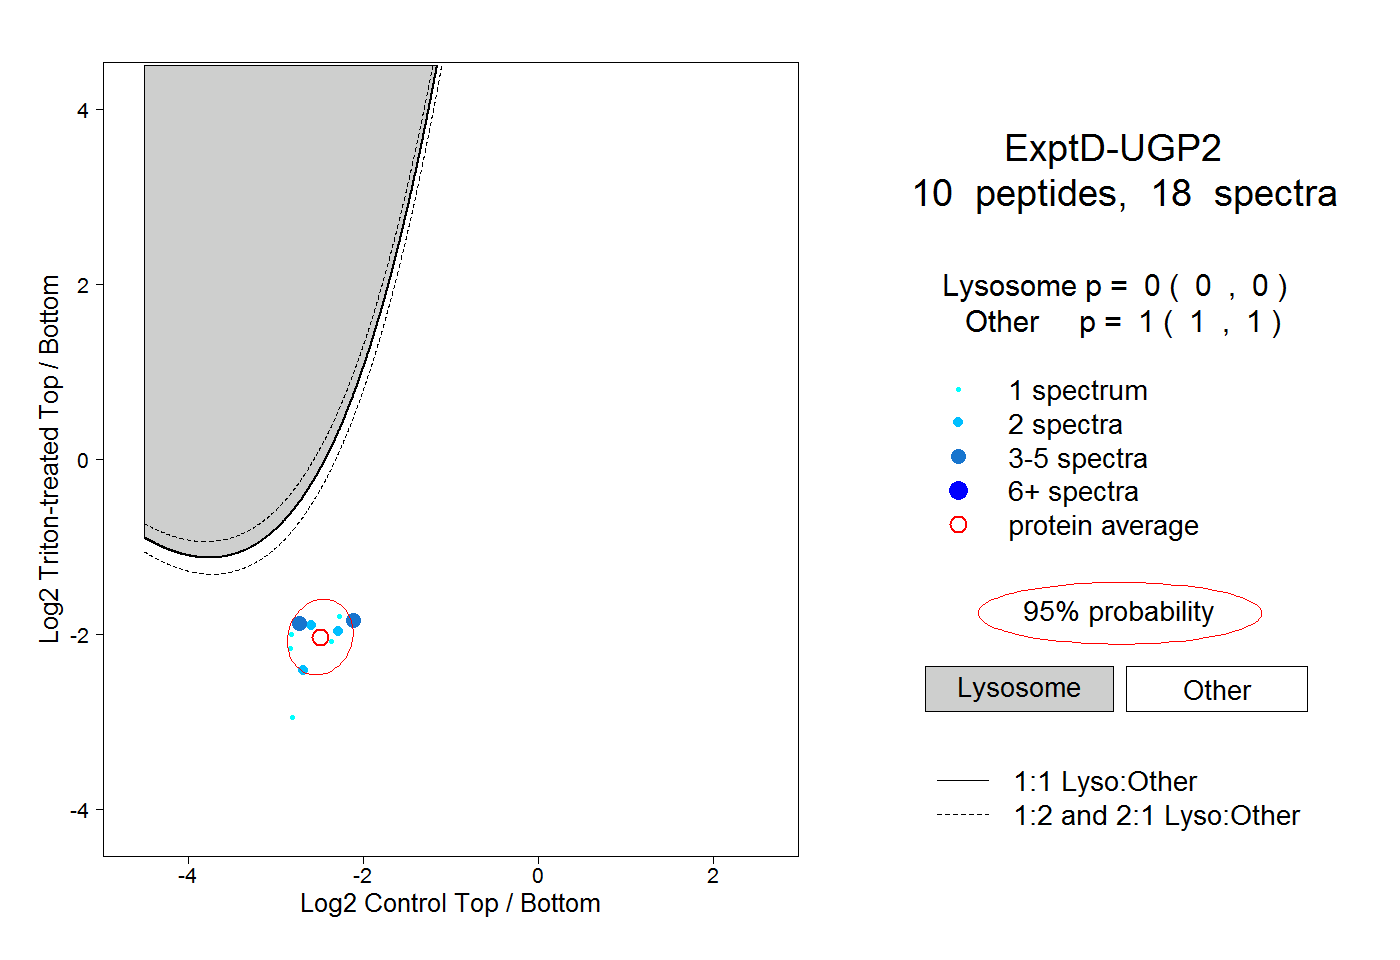
0.000 | 0.000
1.000 | 1.000