 29
29peptides
spectra
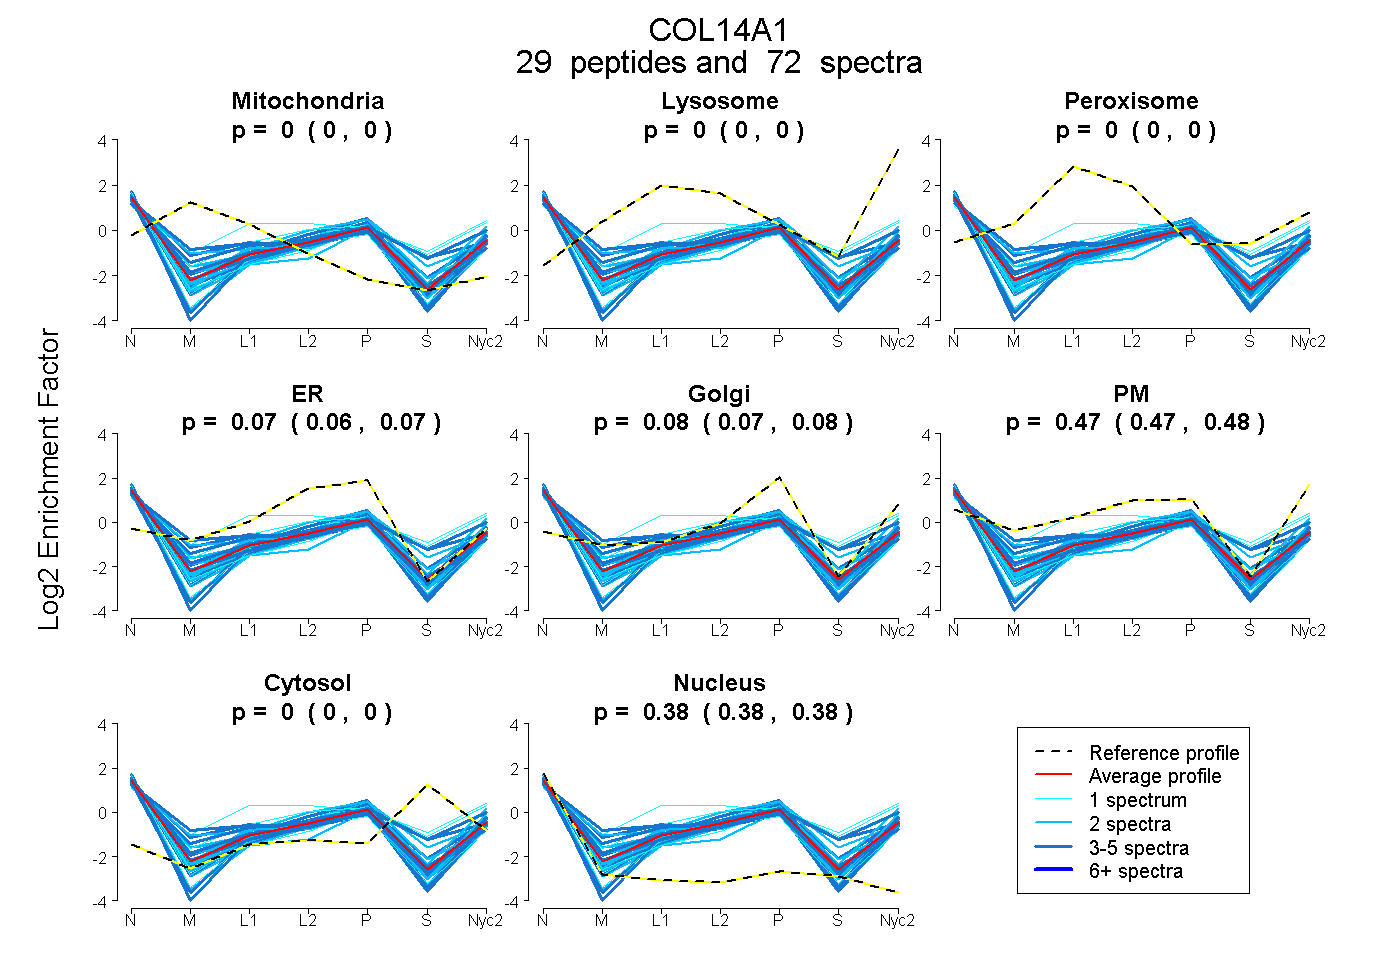
0.000 | 0.000
0.000 | 0.000
0.000 | 0.000
0.063 | 0.074
0.069 | 0.081
0.467 | 0.478
0.000 | 0.000
0.381 | 0.384
3peptides
spectra
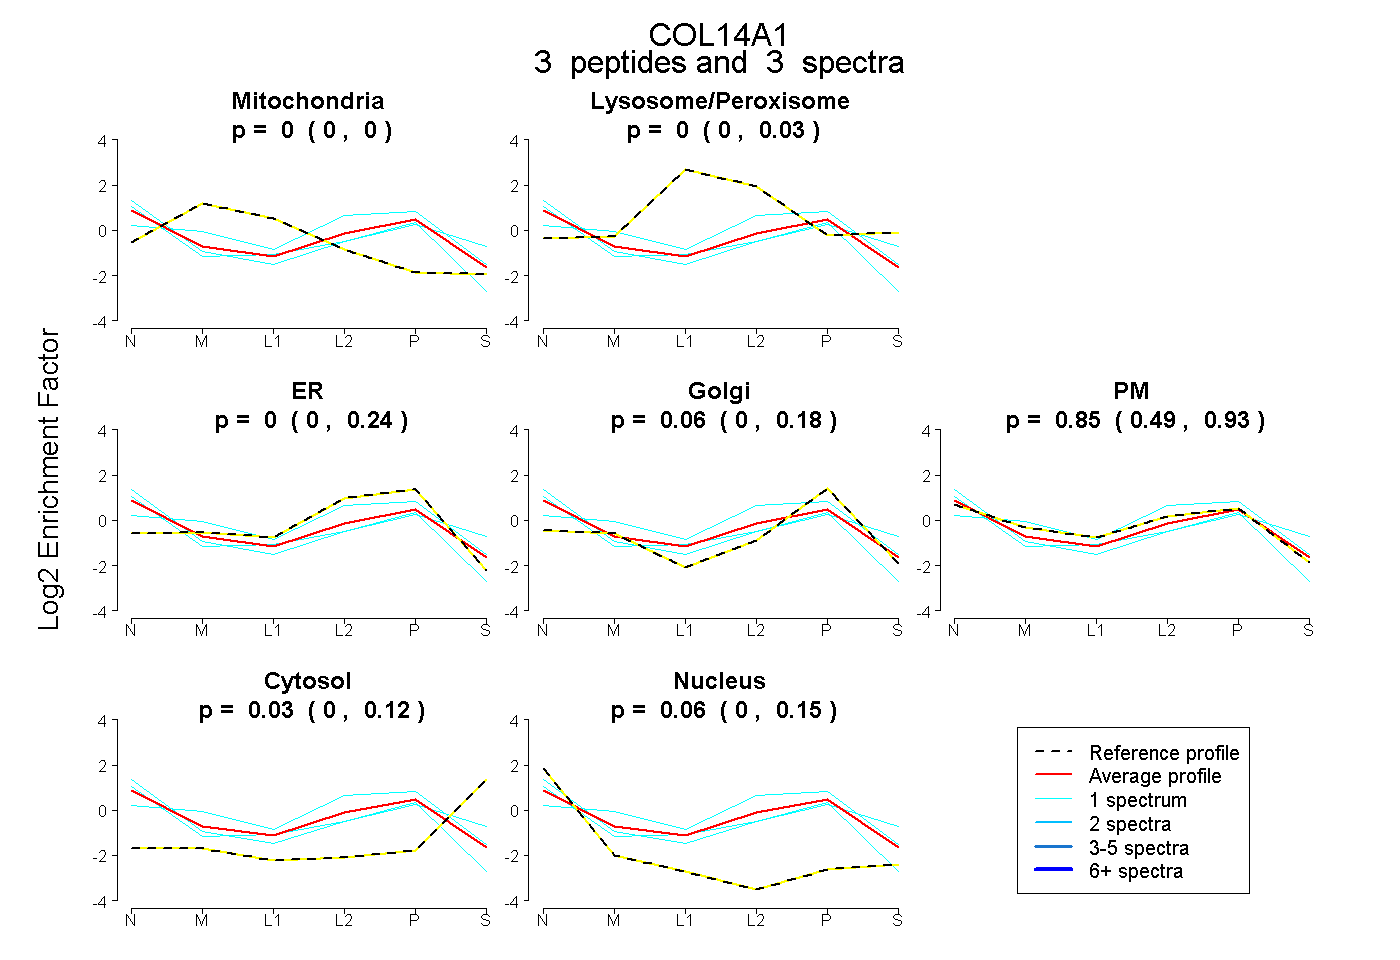
0.000 | 0.000
0.000 | 0.030
0.000 | 0.241
0.000 | 0.176
0.489 | 0.932
0.000 | 0.119
0.000 | 0.147
25peptides
spectra
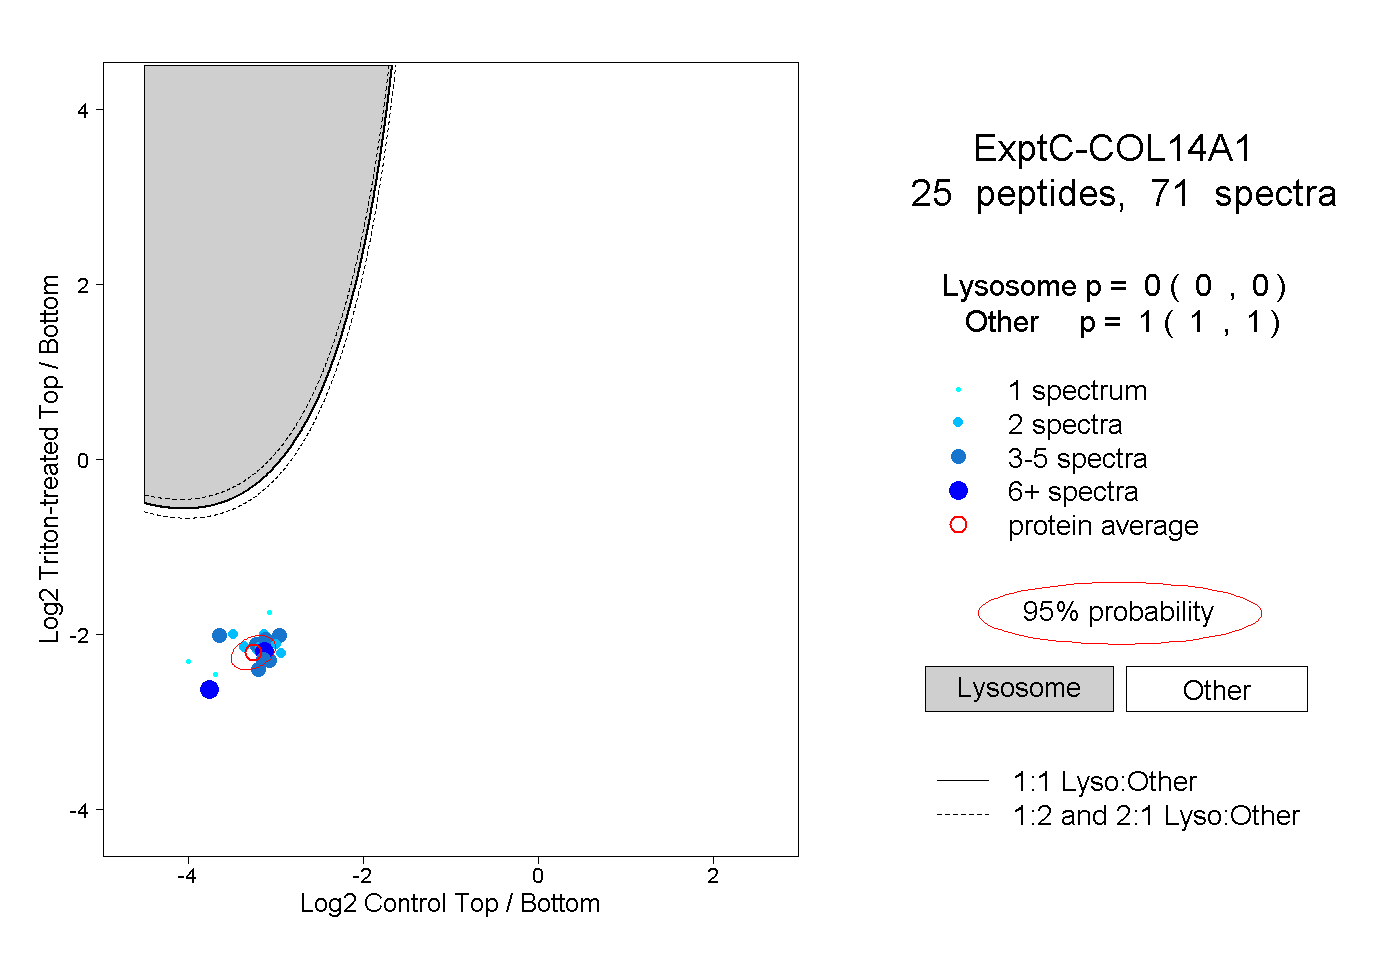
0.000 | 0.000
1.000 | 1.000
4peptides
spectra
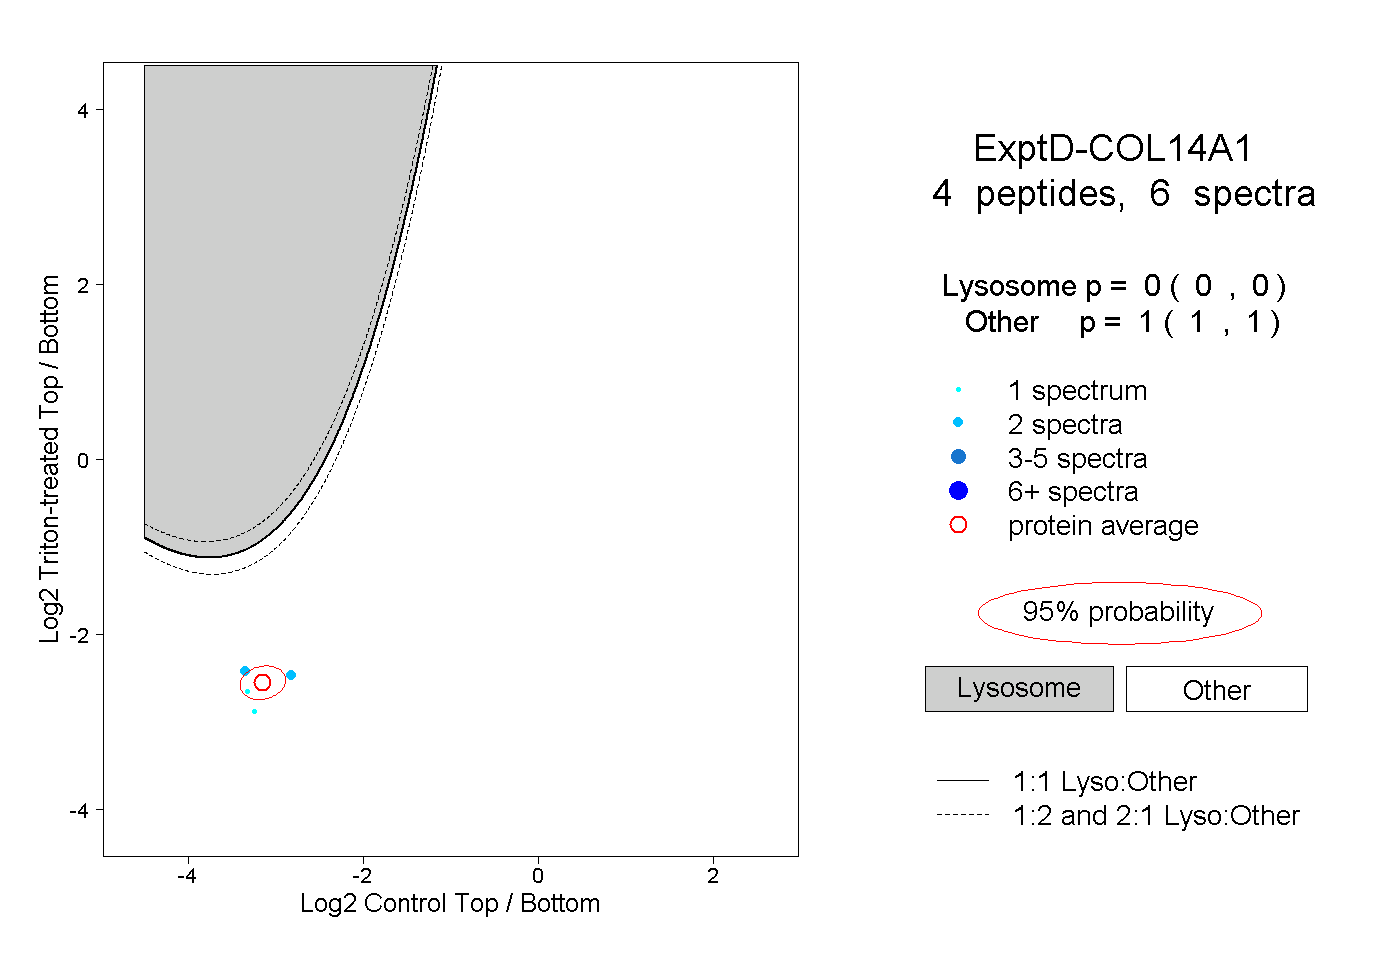
0.000 | 0.000
1.000 | 1.000