 29
29peptides
spectra
0.000 | 0.000
0.000 | 0.000
0.000 | 0.000
0.063 | 0.074
0.069 | 0.081
0.467 | 0.478
0.000 | 0.000
0.381 | 0.384
| Plot | Mito | Lyso | Perox | ER | Golgi | PM | Cytosol | Nucleus | |||||
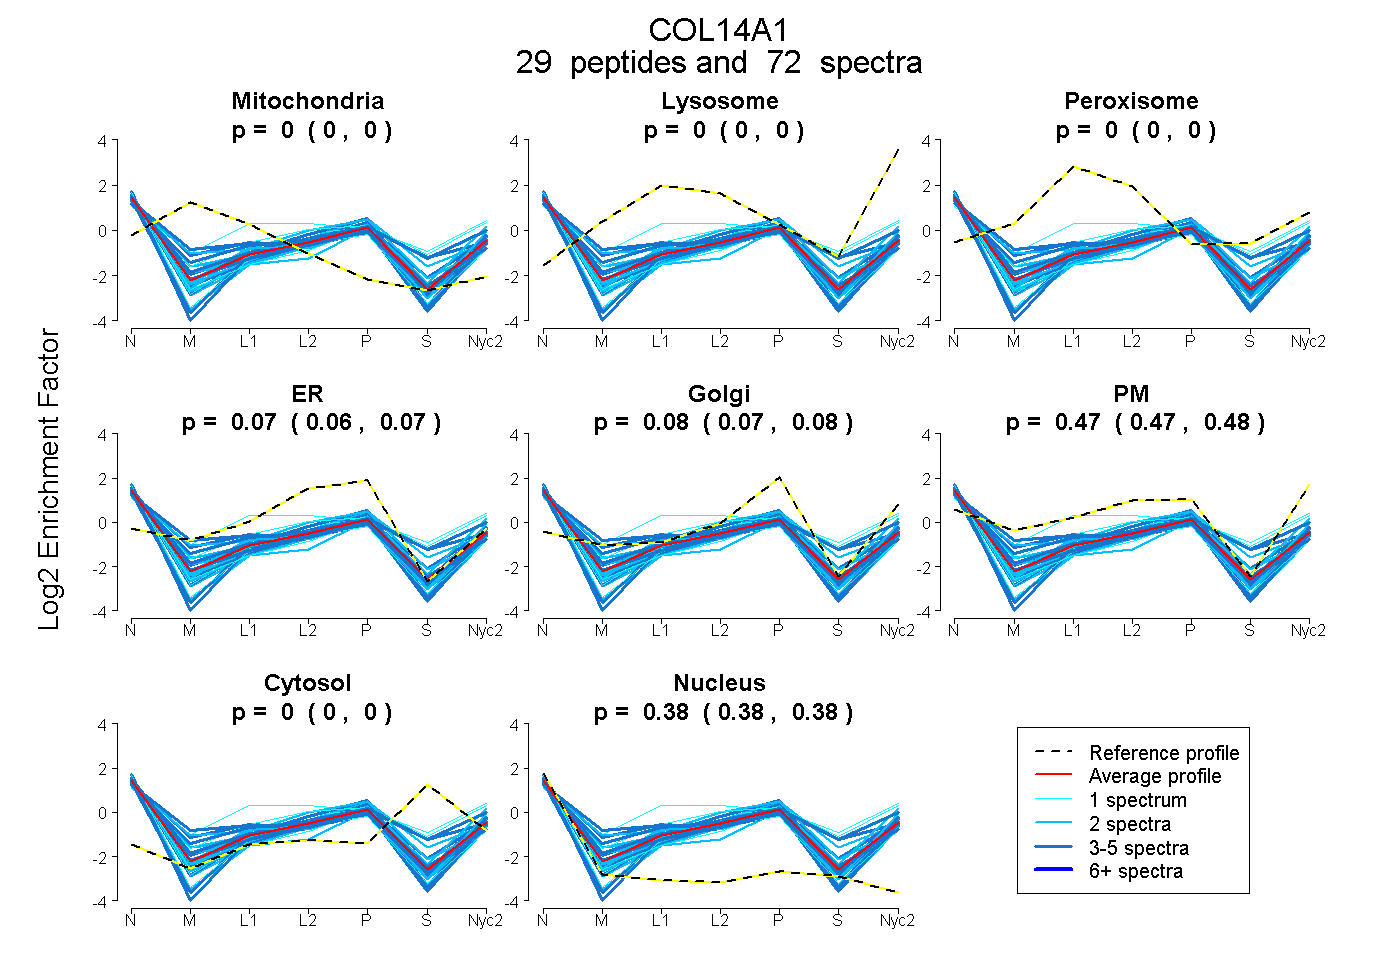
| Expt A |
29 peptides |
72 spectra |
|
0.000 0.000 | 0.000 |
0.000 0.000 | 0.000 |
0.000 0.000 | 0.000 |
0.069 0.063 | 0.074 |
0.076 0.069 | 0.081 |
0.473 0.467 | 0.478 |
0.000 0.000 | 0.000 |
0.382 0.381 | 0.384 |
| 3 spectra, HVFFVDDFDAFK | 0.000 | 0.000 | 0.000 | 0.171 | 0.084 | 0.294 | 0.000 | 0.452 | ||
| 2 spectra, LMWIPVYGGK | 0.000 | 0.000 | 0.000 | 0.000 | 0.134 | 0.519 | 0.019 | 0.329 | ||
| 2 spectra, SEPLVGIILDNGGK | 0.000 | 0.000 | 0.000 | 0.000 | 0.000 | 0.618 | 0.000 | 0.382 | ||
| 3 spectra, ISVYTK | 0.000 | 0.000 | 0.000 | 0.093 | 0.009 | 0.515 | 0.047 | 0.336 | ||
| 2 spectra, QVCEQLIQSHMAR | 0.000 | 0.000 | 0.016 | 0.334 | 0.000 | 0.346 | 0.007 | 0.297 | ||
| 2 spectra, ETLLDAIR | 0.000 | 0.000 | 0.000 | 0.063 | 0.183 | 0.314 | 0.000 | 0.440 | ||
| 3 spectra, MMEMFGLVEK | 0.000 | 0.000 | 0.000 | 0.260 | 0.039 | 0.360 | 0.000 | 0.341 | ||
| 4 spectra, VSEEWYNR | 0.000 | 0.000 | 0.000 | 0.000 | 0.000 | 0.590 | 0.203 | 0.207 | ||
| 2 spectra, GGKPEEVVADGR | 0.000 | 0.000 | 0.000 | 0.110 | 0.163 | 0.338 | 0.113 | 0.276 | ||
| 1 spectrum, IGADGTQVAMVQFTDDPR | 0.000 | 0.000 | 0.000 | 0.155 | 0.035 | 0.426 | 0.000 | 0.384 | ||
| 1 spectrum, HCFYGLQPDSEYK | 0.000 | 0.000 | 0.232 | 0.000 | 0.000 | 0.492 | 0.150 | 0.126 | ||
| 4 spectra, DALVSQPTK | 0.000 | 0.000 | 0.000 | 0.191 | 0.055 | 0.393 | 0.000 | 0.361 | ||
| 2 spectra, SQDDIIPPSR | 0.000 | 0.000 | 0.000 | 0.145 | 0.005 | 0.436 | 0.000 | 0.415 | ||
| 1 spectrum, NLLPDTEYK | 0.000 | 0.000 | 0.000 | 0.000 | 0.232 | 0.349 | 0.000 | 0.419 | ||
| 4 spectra, GDLQSQAMVR | 0.000 | 0.000 | 0.000 | 0.000 | 0.167 | 0.431 | 0.000 | 0.401 | ||
| 5 spectra, TLPTSGPQNLR | 0.000 | 0.000 | 0.000 | 0.011 | 0.098 | 0.482 | 0.000 | 0.409 | ||
| 4 spectra, LTWDPTSGK | 0.010 | 0.000 | 0.008 | 0.000 | 0.000 | 0.642 | 0.000 | 0.339 | ||
| 2 spectra, DEESCPDLPR | 0.000 | 0.000 | 0.000 | 0.076 | 0.015 | 0.525 | 0.000 | 0.383 | ||
| 2 spectra, DTLFTADSGTR | 0.000 | 0.000 | 0.000 | 0.046 | 0.045 | 0.511 | 0.000 | 0.398 | ||
| 1 spectrum, SQDDVNK | 0.000 | 0.000 | 0.000 | 0.000 | 0.000 | 0.625 | 0.235 | 0.140 | ||
| 4 spectra, STSPEEIK | 0.090 | 0.000 | 0.005 | 0.142 | 0.000 | 0.454 | 0.000 | 0.308 | ||
| 2 spectra, DEVIDAVR | 0.000 | 0.000 | 0.000 | 0.043 | 0.059 | 0.496 | 0.000 | 0.402 | ||
| 3 spectra, VIVVITDGR | 0.000 | 0.000 | 0.000 | 0.063 | 0.000 | 0.535 | 0.000 | 0.401 | ||
| 3 spectra, IGLAQYSGDPR | 0.000 | 0.000 | 0.000 | 0.044 | 0.066 | 0.455 | 0.000 | 0.435 | ||
| 3 spectra, LLVAPASGGK | 0.000 | 0.000 | 0.000 | 0.017 | 0.145 | 0.273 | 0.265 | 0.300 | ||
| 2 spectra, GNPGIGTQGPR | 0.000 | 0.000 | 0.000 | 0.000 | 0.326 | 0.188 | 0.000 | 0.486 | ||
| 2 spectra, IGILITDGK | 0.000 | 0.000 | 0.000 | 0.054 | 0.105 | 0.395 | 0.000 | 0.446 | ||
| 1 spectrum, NFLENLVTAFNVGSEK | 0.000 | 0.000 | 0.000 | 0.167 | 0.032 | 0.320 | 0.000 | 0.481 | ||
| 2 spectra, ISNVGSNSAR | 0.000 | 0.000 | 0.000 | 0.026 | 0.137 | 0.456 | 0.000 | 0.381 |
| Plot | Mito | Lyso or Perox | ER | Golgi | PM | Cytosol | Nucleus | ||||||
| Expt B |
3 peptides |
3 spectra |
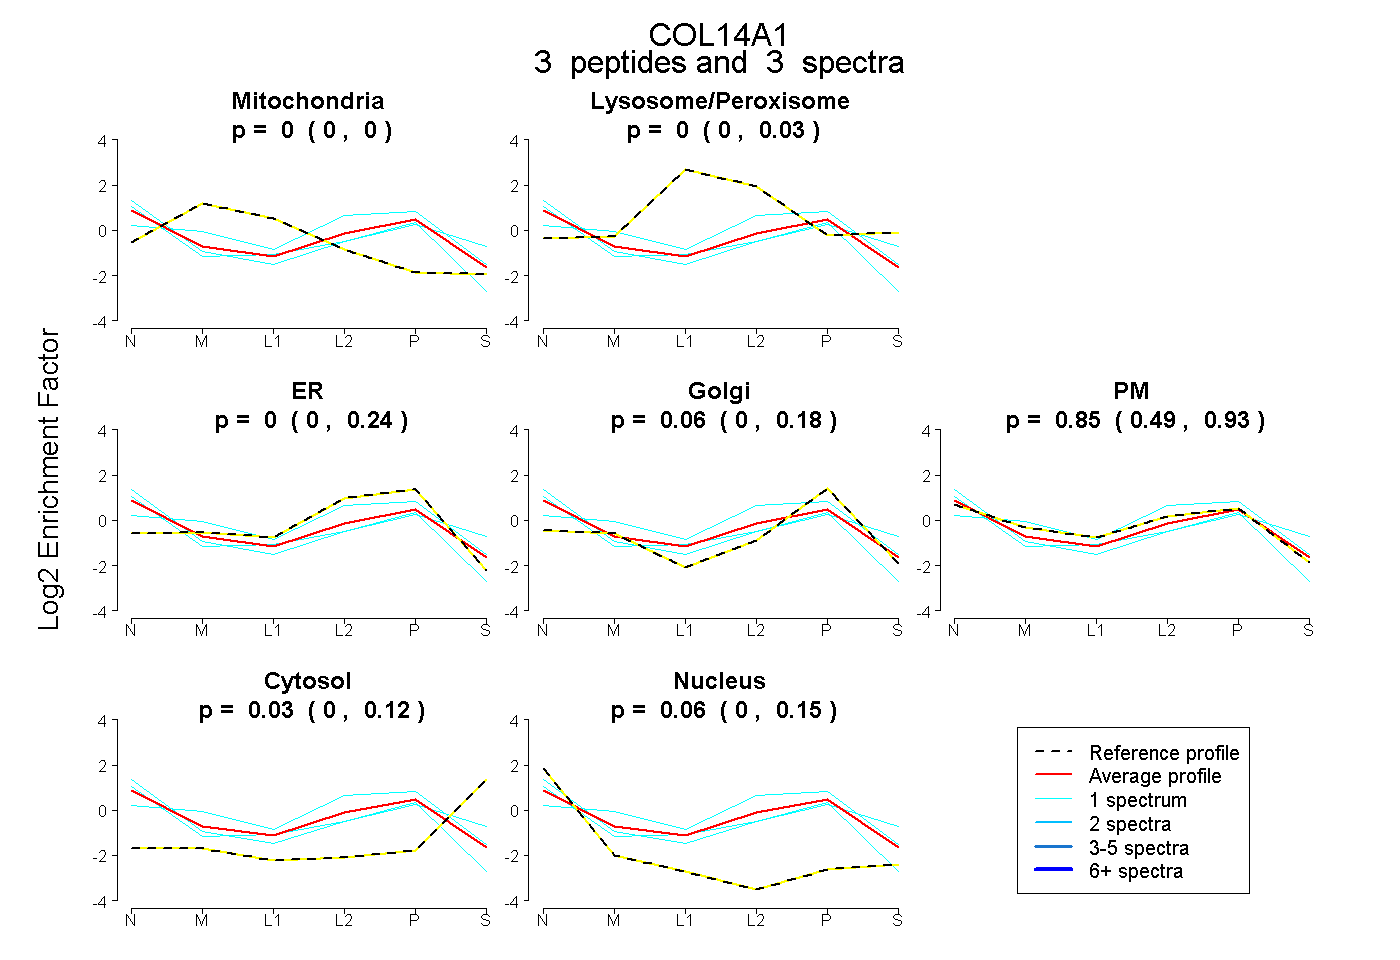 |
0.000 0.000 | 0.000 |
0.000 0.000 | 0.030 |
0.000 0.000 | 0.241 |
0.058 0.000 | 0.176 |
0.850 0.489 | 0.932 |
0.027 0.000 | 0.119 |
0.065 0.000 | 0.147 |
|||
| Plot | Lyso | Other | |||||||||||
| Expt C |
25 peptides |
71 spectra |
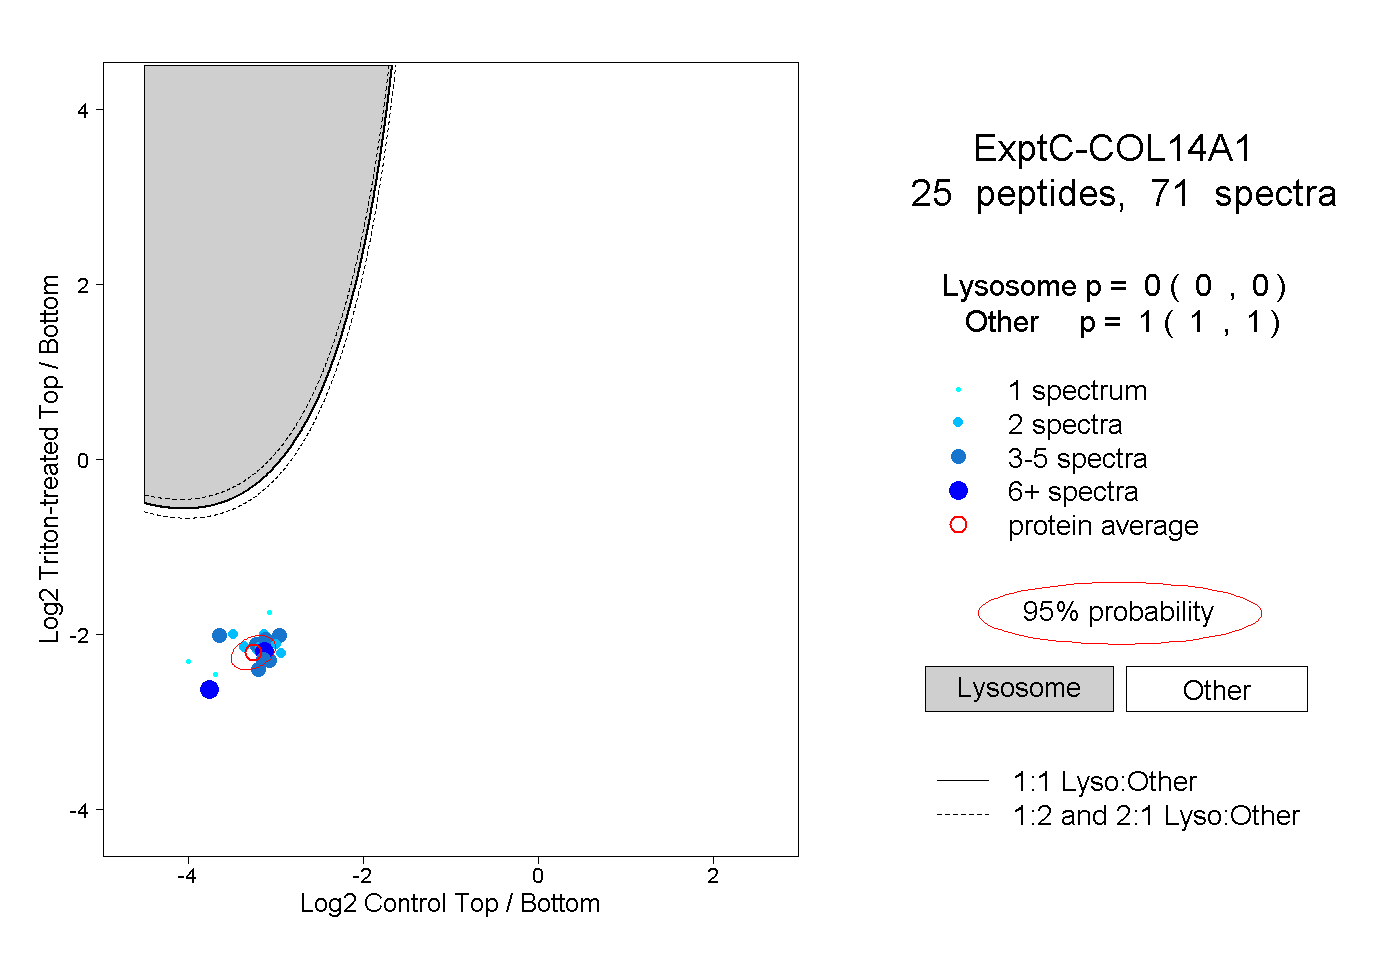 |
0.000 0.000 | 0.000 |
1.000 1.000 | 1.000 |
||||||||
| Plot | Lyso | Other | |||||||||||
| Expt D |
4 peptides |
6 spectra |
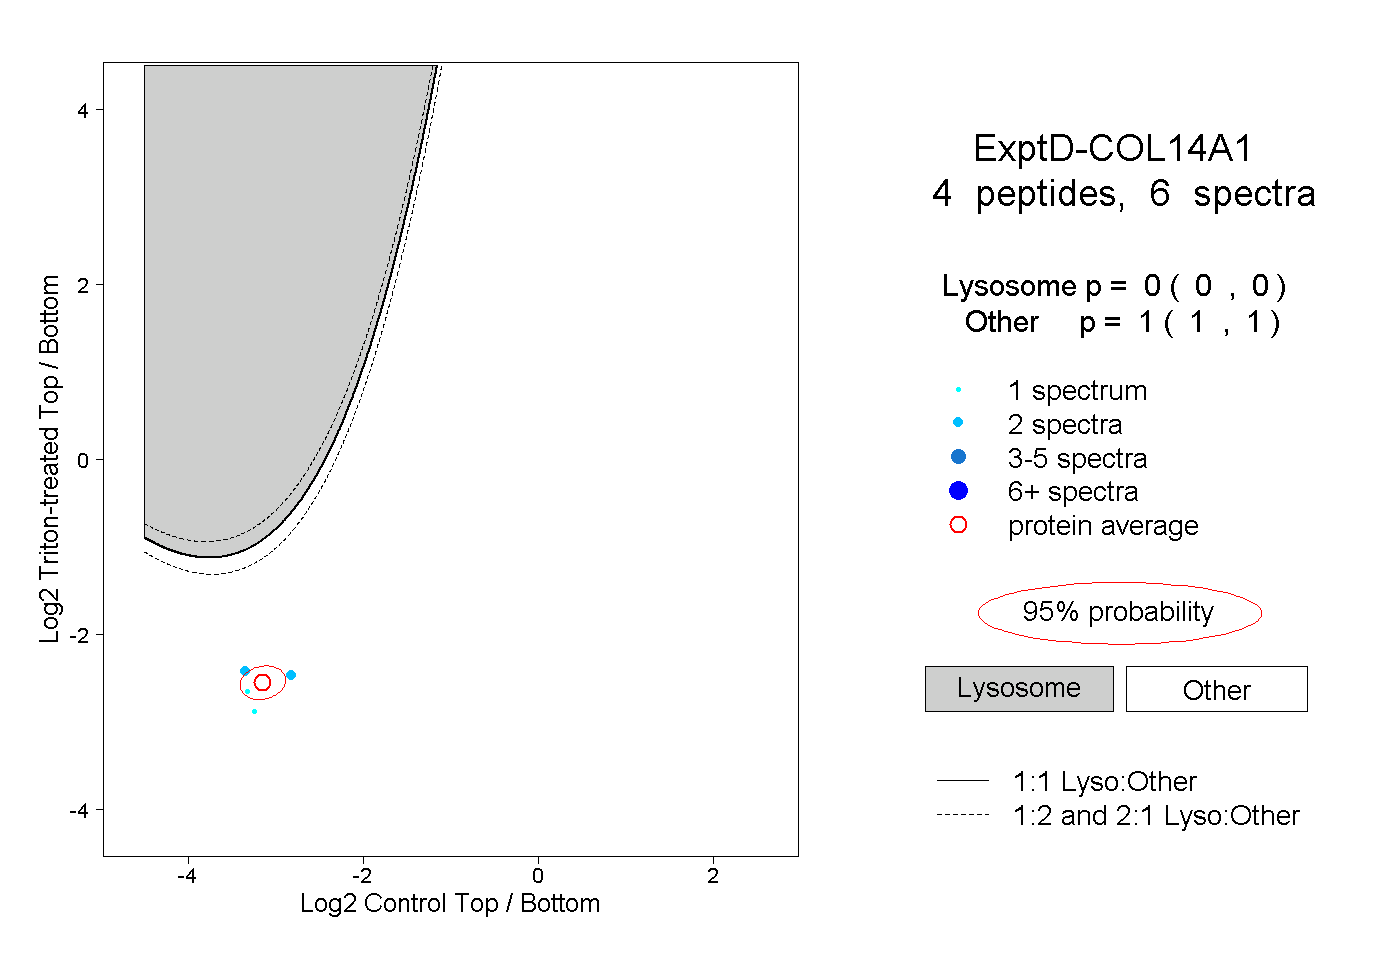 |
0.000 0.000 | 0.000 |
1.000 1.000 | 1.000 |