 8
8peptides
spectra
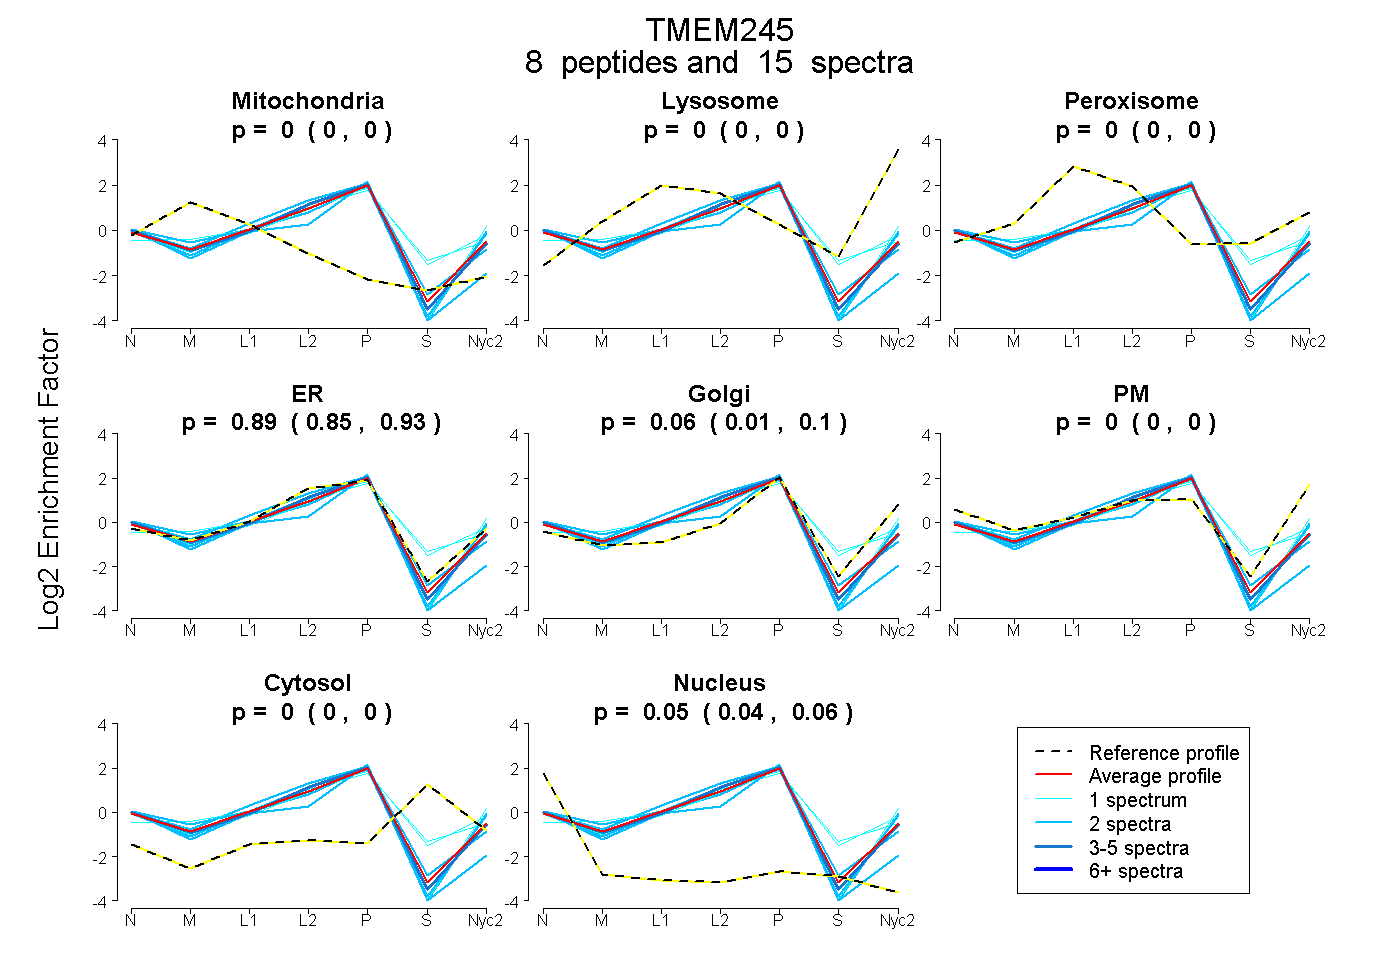
0.000 | 0.001
0.000 | 0.000
0.000 | 0.000
0.854 | 0.925
0.015 | 0.097
0.000 | 0.000
0.000 | 0.000
0.038 | 0.056
4peptides
spectra
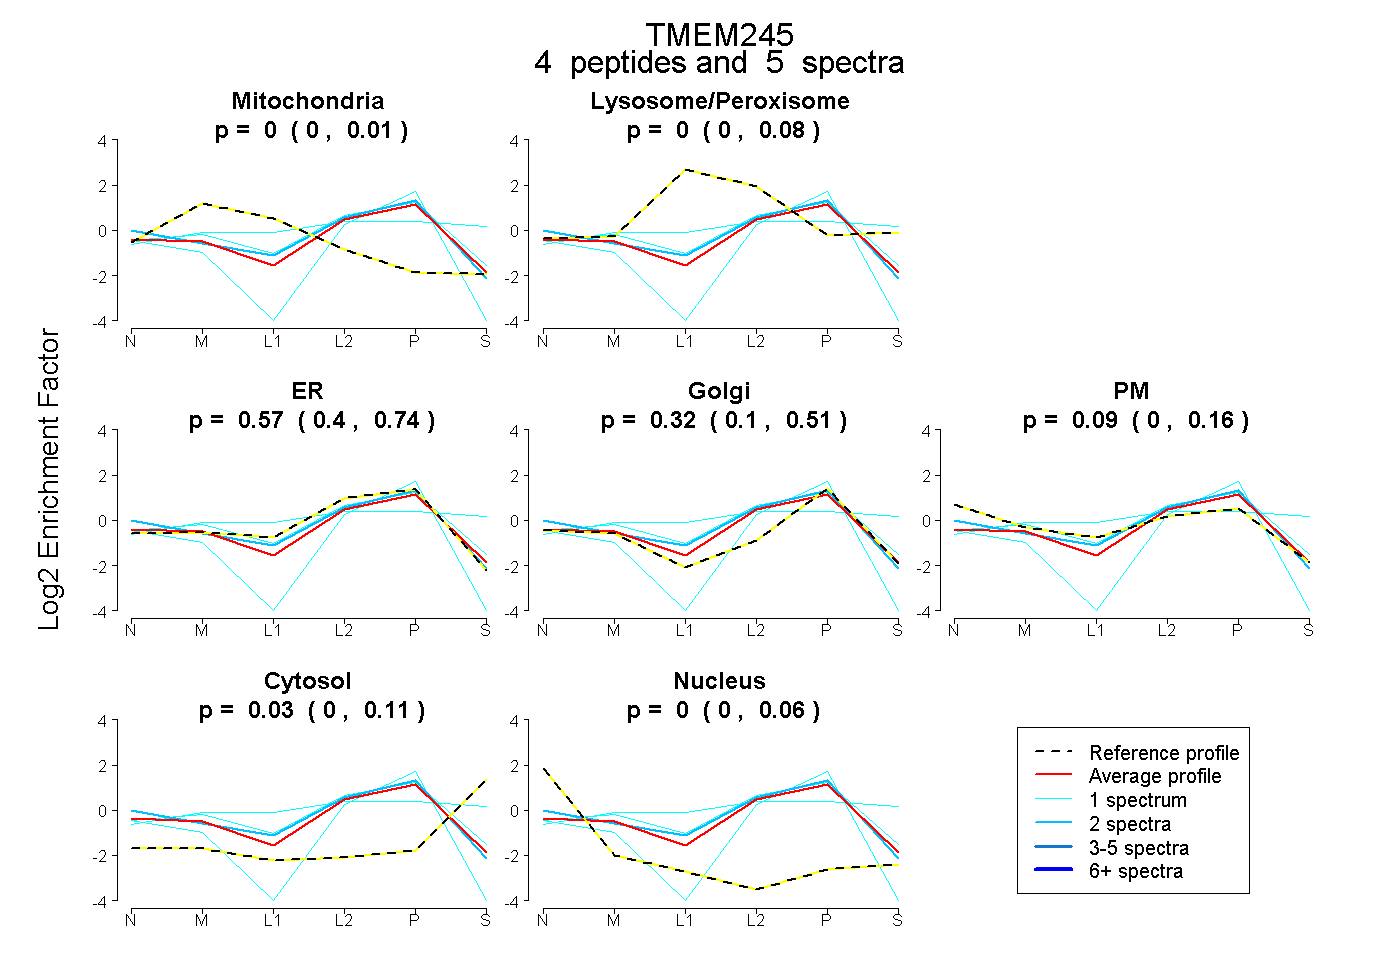
0.000 | 0.013
0.000 | 0.079
0.402 | 0.743
0.101 | 0.505
0.000 | 0.159
0.000 | 0.113
0.000 | 0.057
3peptides
spectra
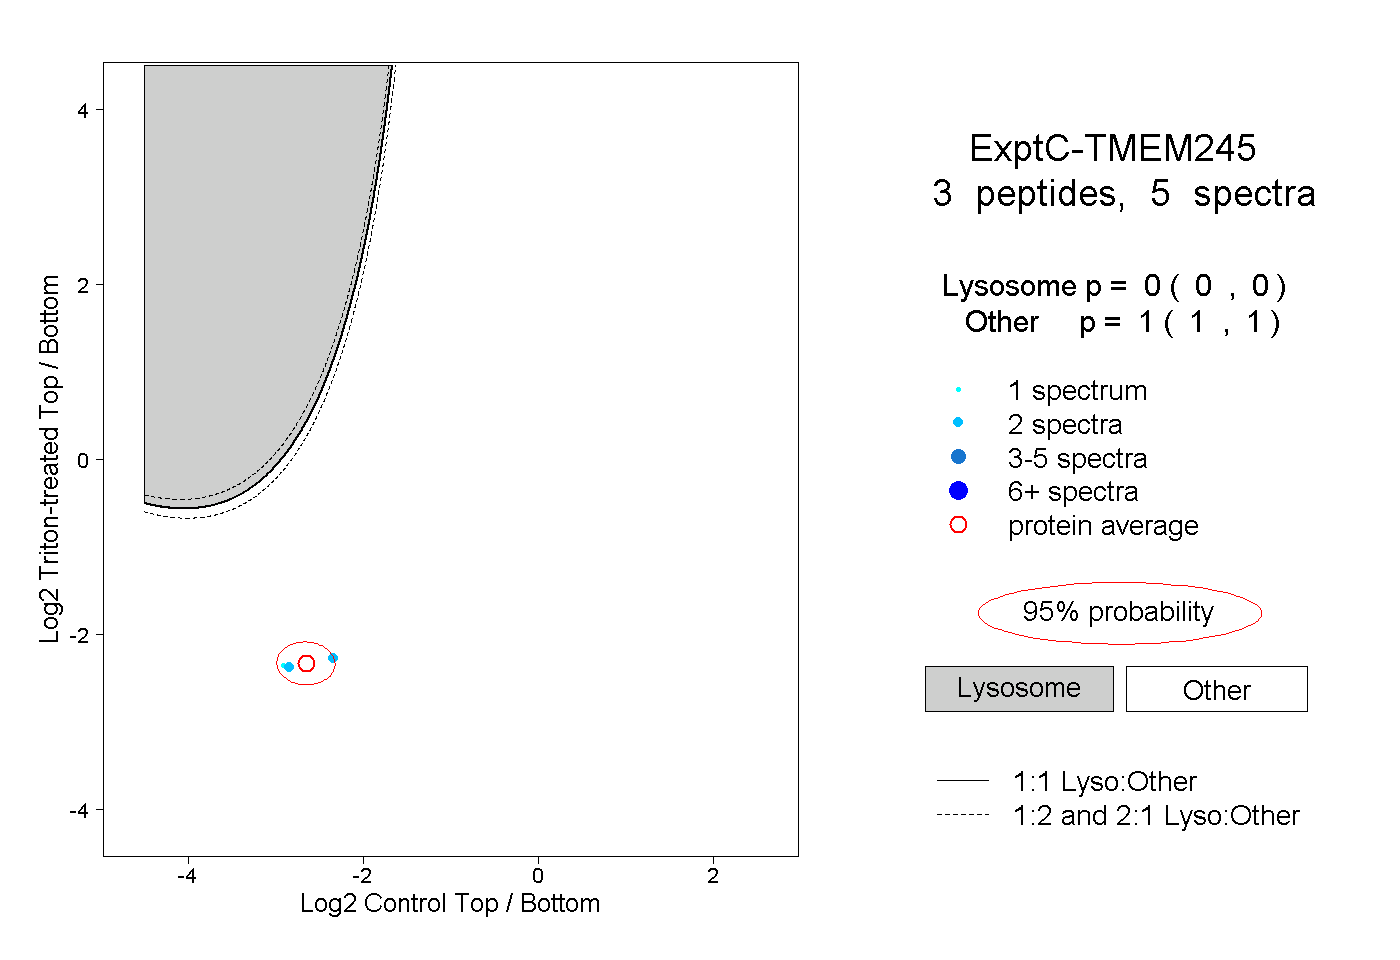
0.000 | 0.000
1.000 | 1.000
2peptides
spectra
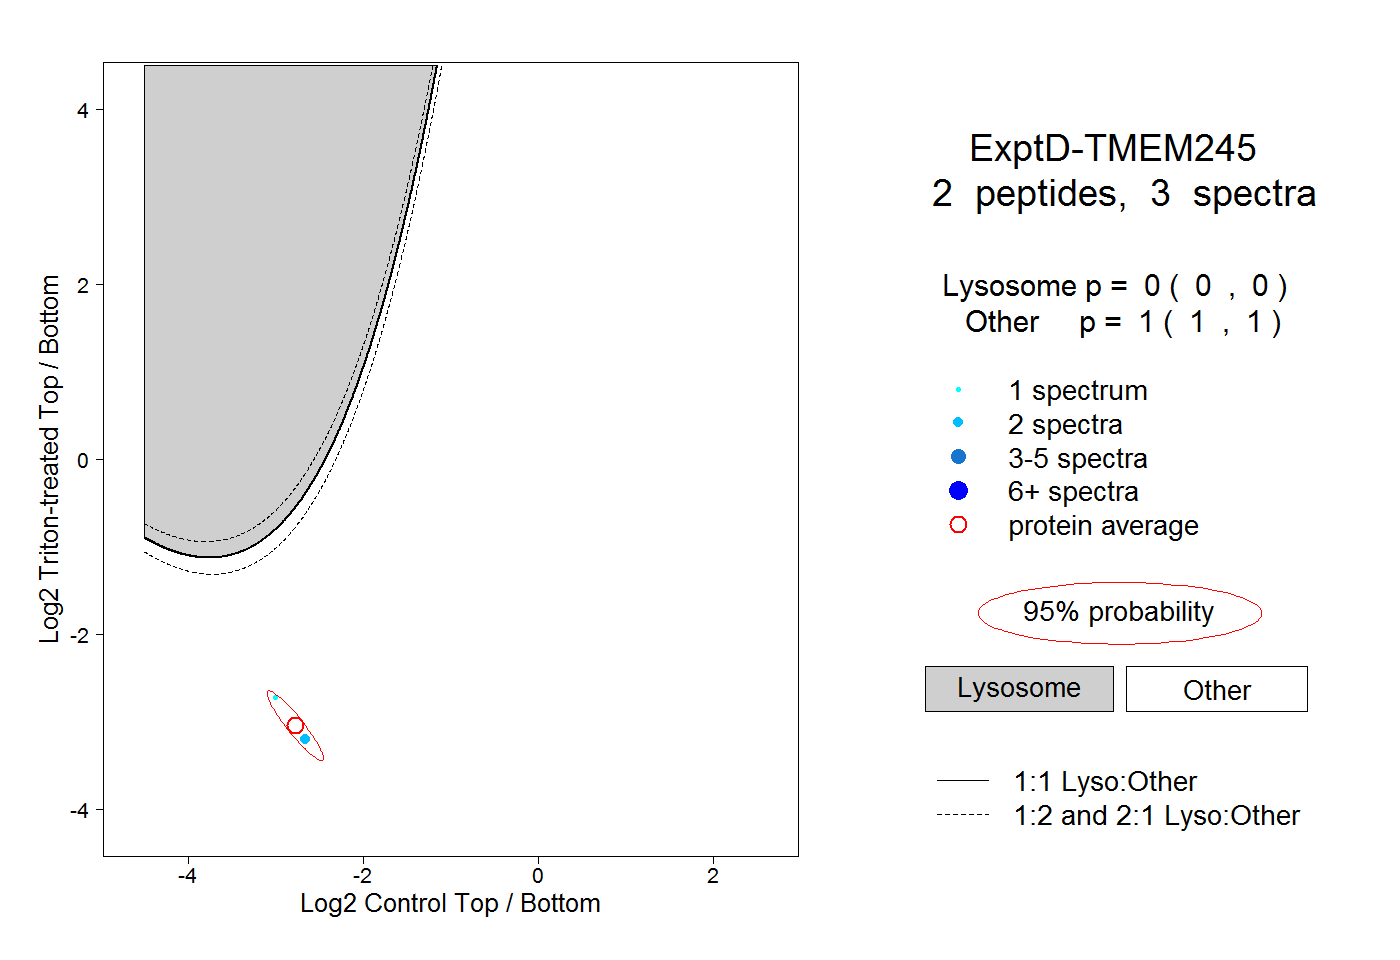
0.000 | 0.000
1.000 | 1.000