 8
8peptides
spectra
0.000 | 0.001
0.000 | 0.000
0.000 | 0.000
0.854 | 0.925
0.015 | 0.097
0.000 | 0.000
0.000 | 0.000
0.038 | 0.056
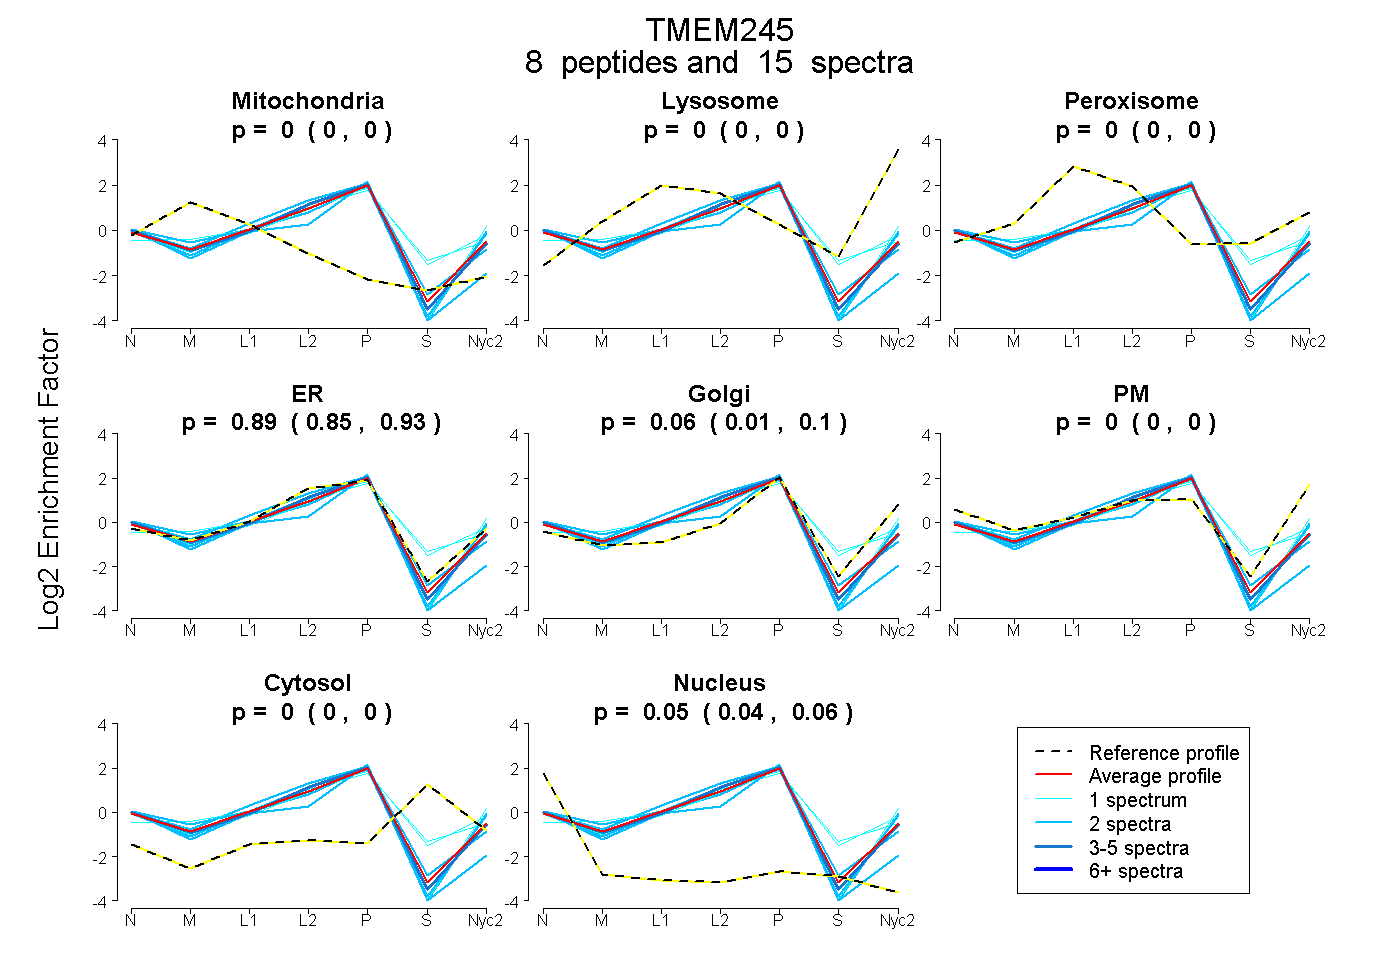
| Plot | Mito | Lyso | Perox | ER | Golgi | PM | Cytosol | Nucleus | |||||
| Expt A |
8 peptides |
15 spectra |
|
0.000 0.000 | 0.001 |
0.000 0.000 | 0.000 |
0.000 0.000 | 0.000 |
0.893 0.854 | 0.925 |
0.059 0.015 | 0.097 |
0.000 0.000 | 0.000 |
0.000 0.000 | 0.000 |
0.048 0.038 | 0.056 |
| 2 spectra, SSPSSPSPTLGR | 0.000 | 0.000 | 0.000 | 0.826 | 0.000 | 0.000 | 0.000 | 0.174 | ||
| 1 spectrum, QRPEMGTFLR | 0.000 | 0.000 | 0.092 | 0.735 | 0.030 | 0.000 | 0.143 | 0.000 | ||
| 1 spectrum, LYHSWFVK | 0.000 | 0.000 | 0.000 | 0.691 | 0.259 | 0.047 | 0.000 | 0.003 | ||
| 1 spectrum, EWITHK | 0.000 | 0.000 | 0.062 | 0.739 | 0.083 | 0.000 | 0.116 | 0.000 | ||
| 2 spectra, QVLELWDR | 0.019 | 0.000 | 0.000 | 0.849 | 0.026 | 0.091 | 0.000 | 0.015 | ||
| 2 spectra, GGPAEEPSPR | 0.000 | 0.000 | 0.000 | 0.897 | 0.020 | 0.000 | 0.000 | 0.082 | ||
| 4 spectra, TAGPSETPR | 0.000 | 0.000 | 0.000 | 0.949 | 0.000 | 0.000 | 0.000 | 0.051 | ||
| 2 spectra, ALNSAANNVYQYGR | 0.000 | 0.000 | 0.000 | 0.922 | 0.000 | 0.078 | 0.000 | 0.000 |
| Plot | Mito | Lyso or Perox | ER | Golgi | PM | Cytosol | Nucleus | ||||||
| Expt B |
4 peptides |
5 spectra |
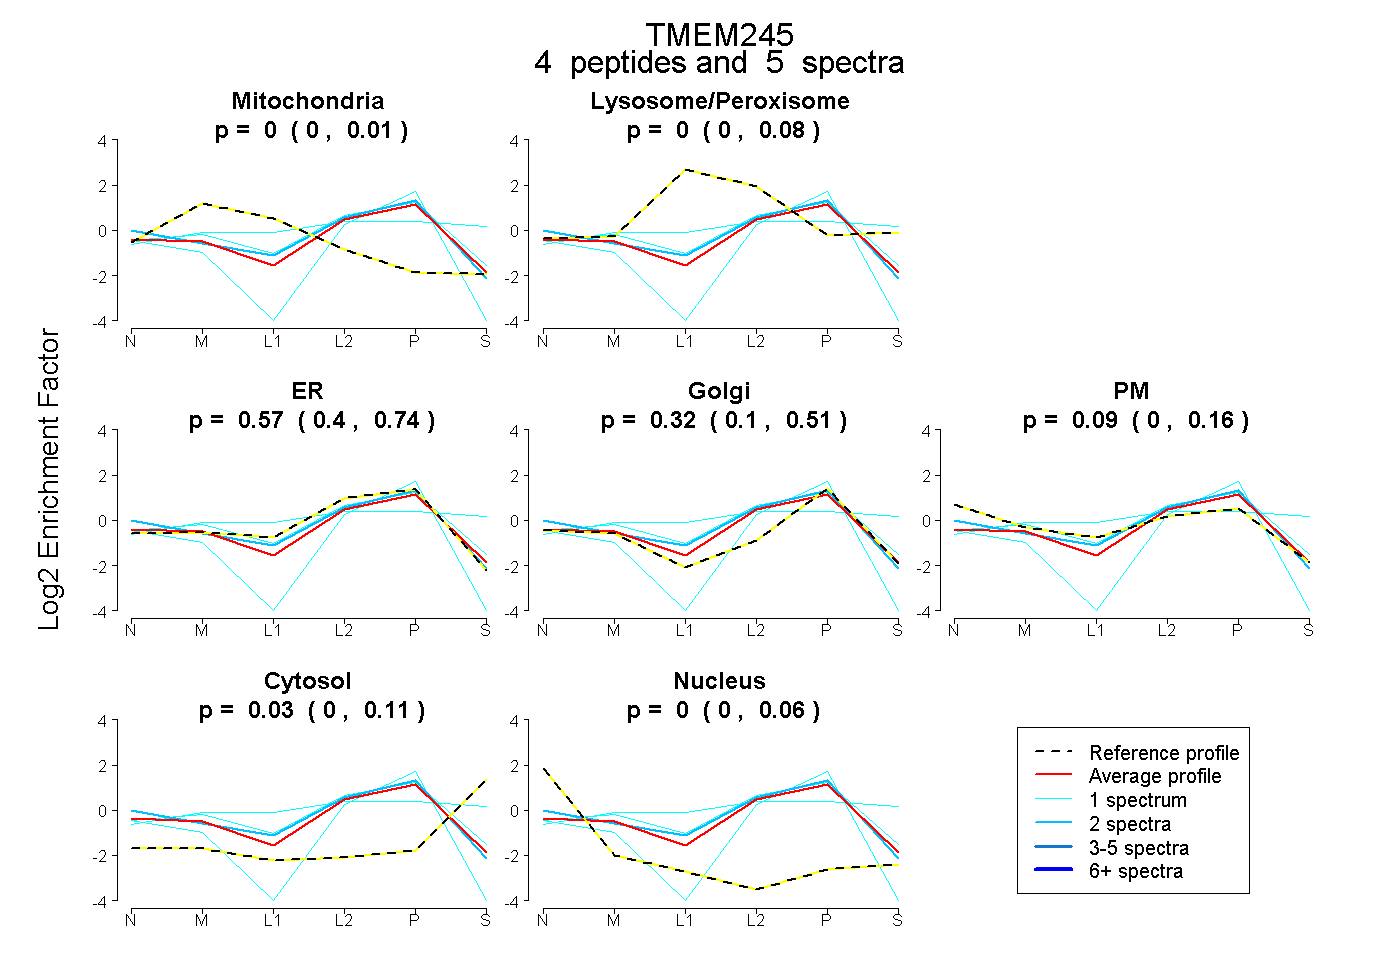 |
0.000 0.000 | 0.013 |
0.000 0.000 | 0.079 |
0.566 0.402 | 0.743 |
0.315 0.101 | 0.505 |
0.086 0.000 | 0.159 |
0.033 0.000 | 0.113 |
0.000 0.000 | 0.057 |
|||
| Plot | Lyso | Other | |||||||||||
| Expt C |
3 peptides |
5 spectra |
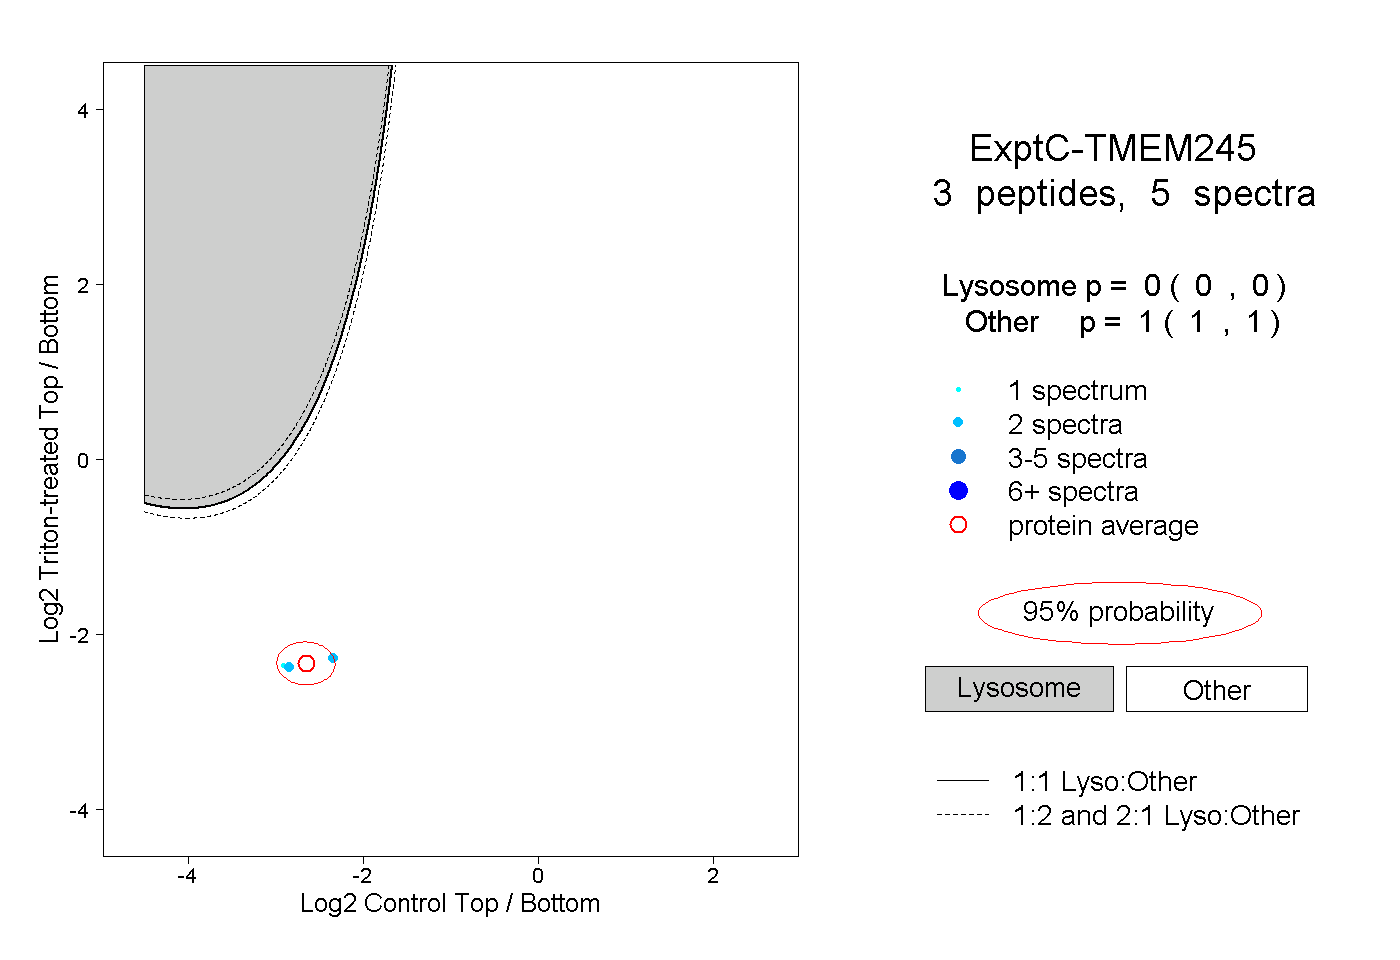 |
0.000 0.000 | 0.000 |
1.000 1.000 | 1.000 |
||||||||
| Plot | Lyso | Other | |||||||||||
| Expt D |
2 peptides |
3 spectra |
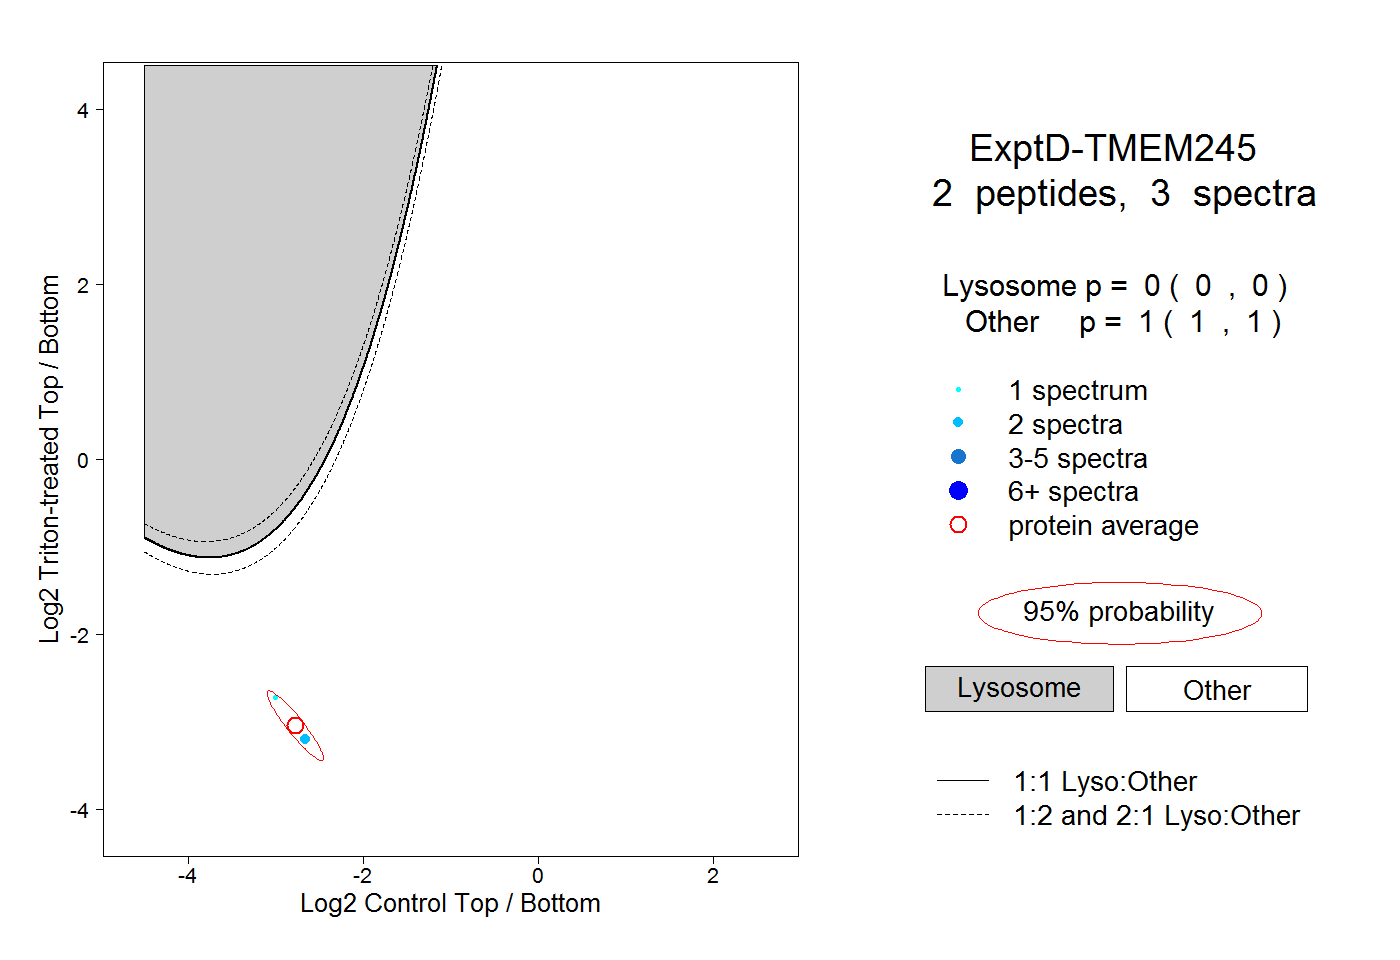 |
0.000 0.000 | 0.000 |
1.000 1.000 | 1.000 |