 3
3peptides
spectra
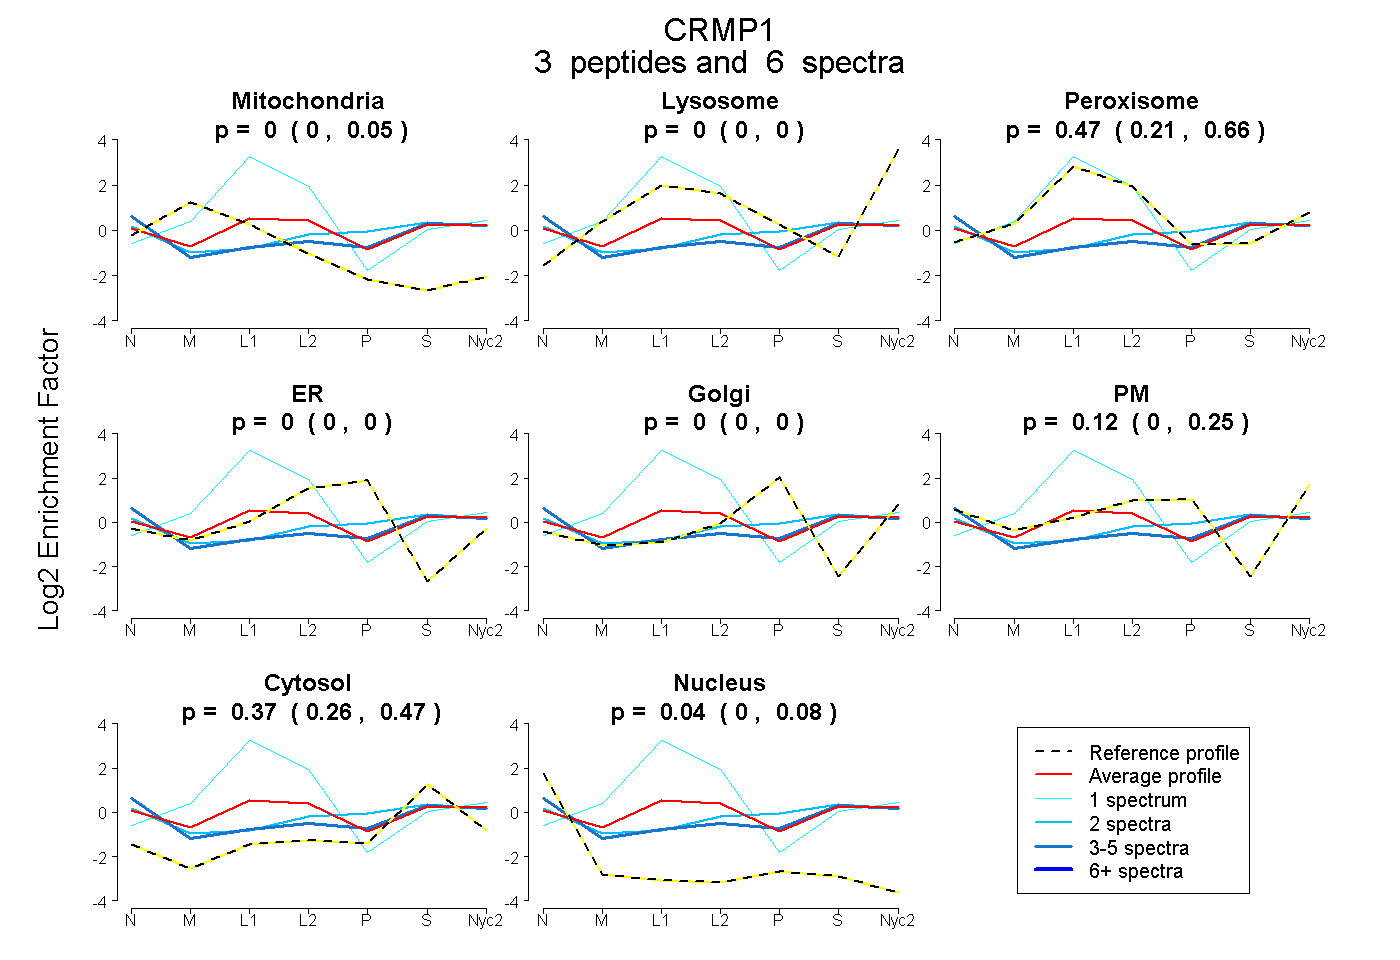
0.000 | 0.053
0.000 | 0.000
0.212 | 0.657
0.000 | 0.000
0.000 | 0.000
0.000 | 0.251
0.256 | 0.472
0.000 | 0.081
1peptide
spectra
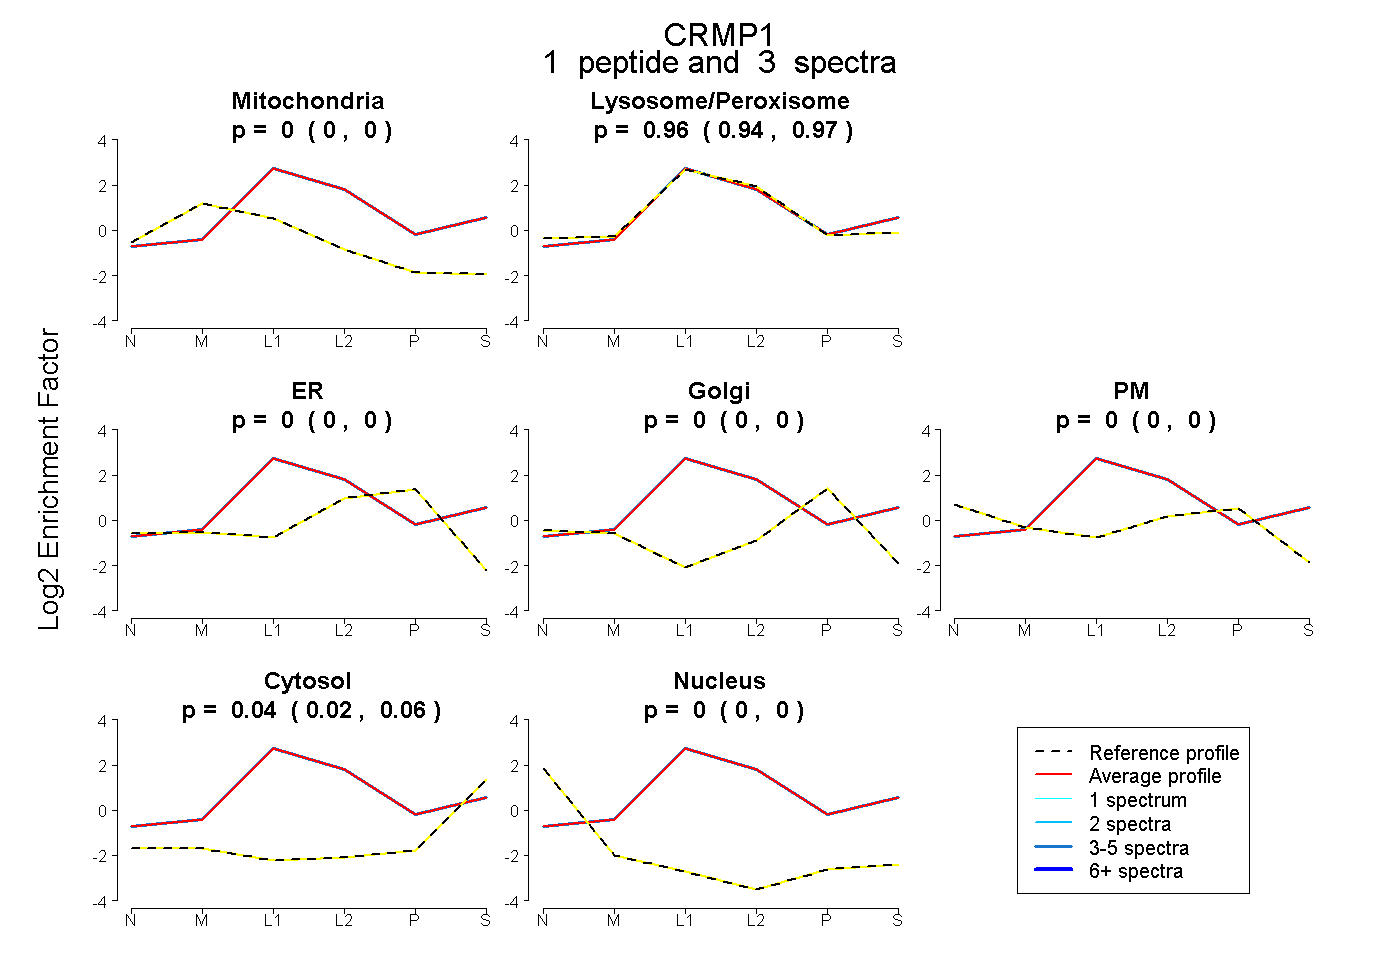
0.000 | 0.000
0.939 | 0.972
0.000 | 0.000
0.000 | 0.000
0.000 | 0.000
0.025 | 0.057
0.000 | 0.000
1peptide
spectrum
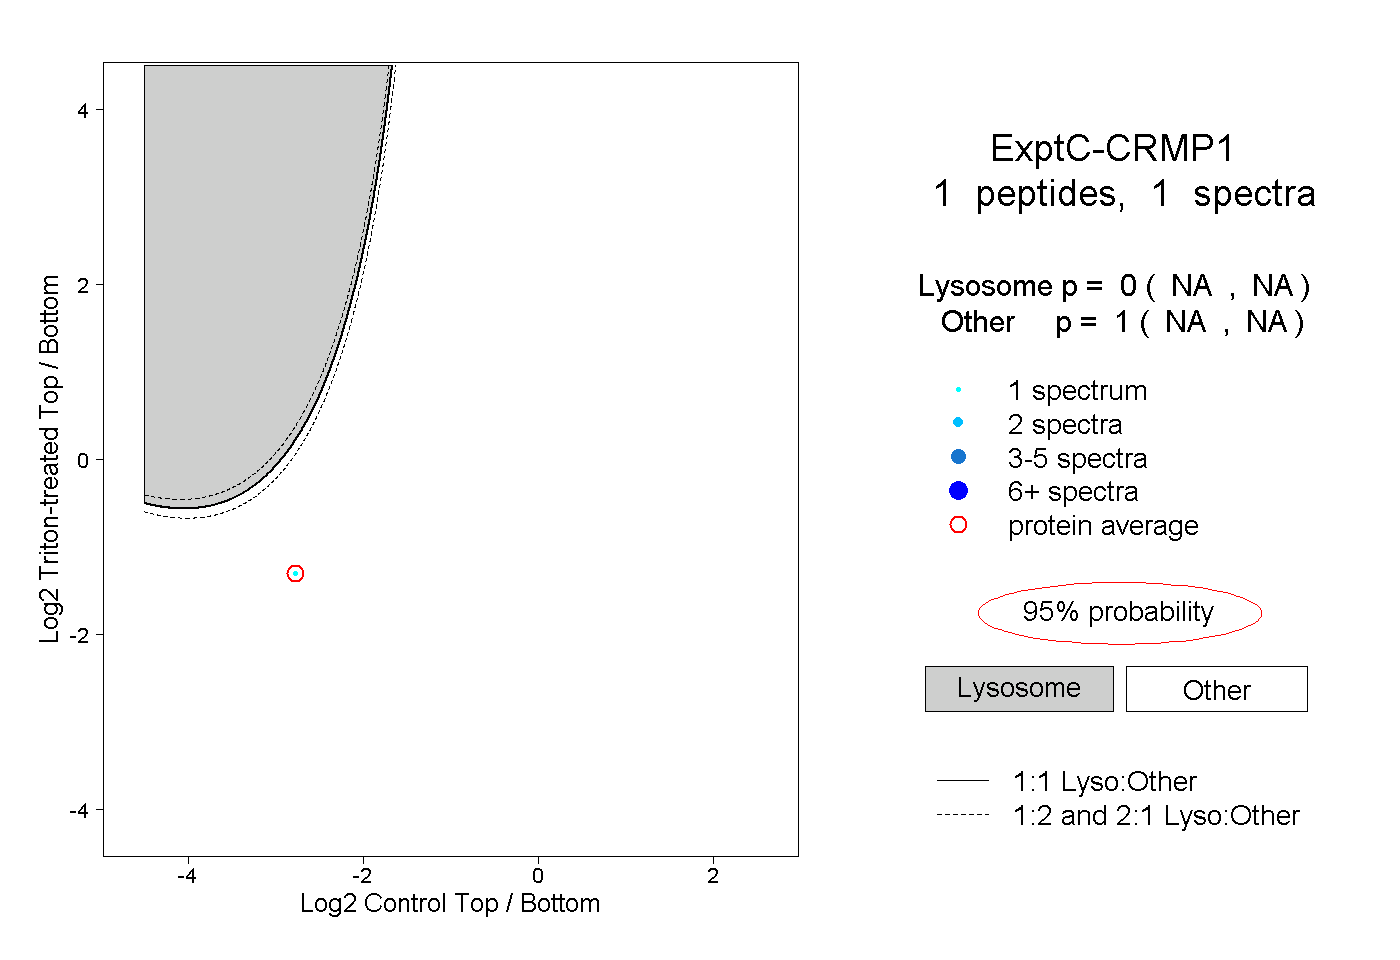
NA | NA
NA | NA
1peptide
spectrum
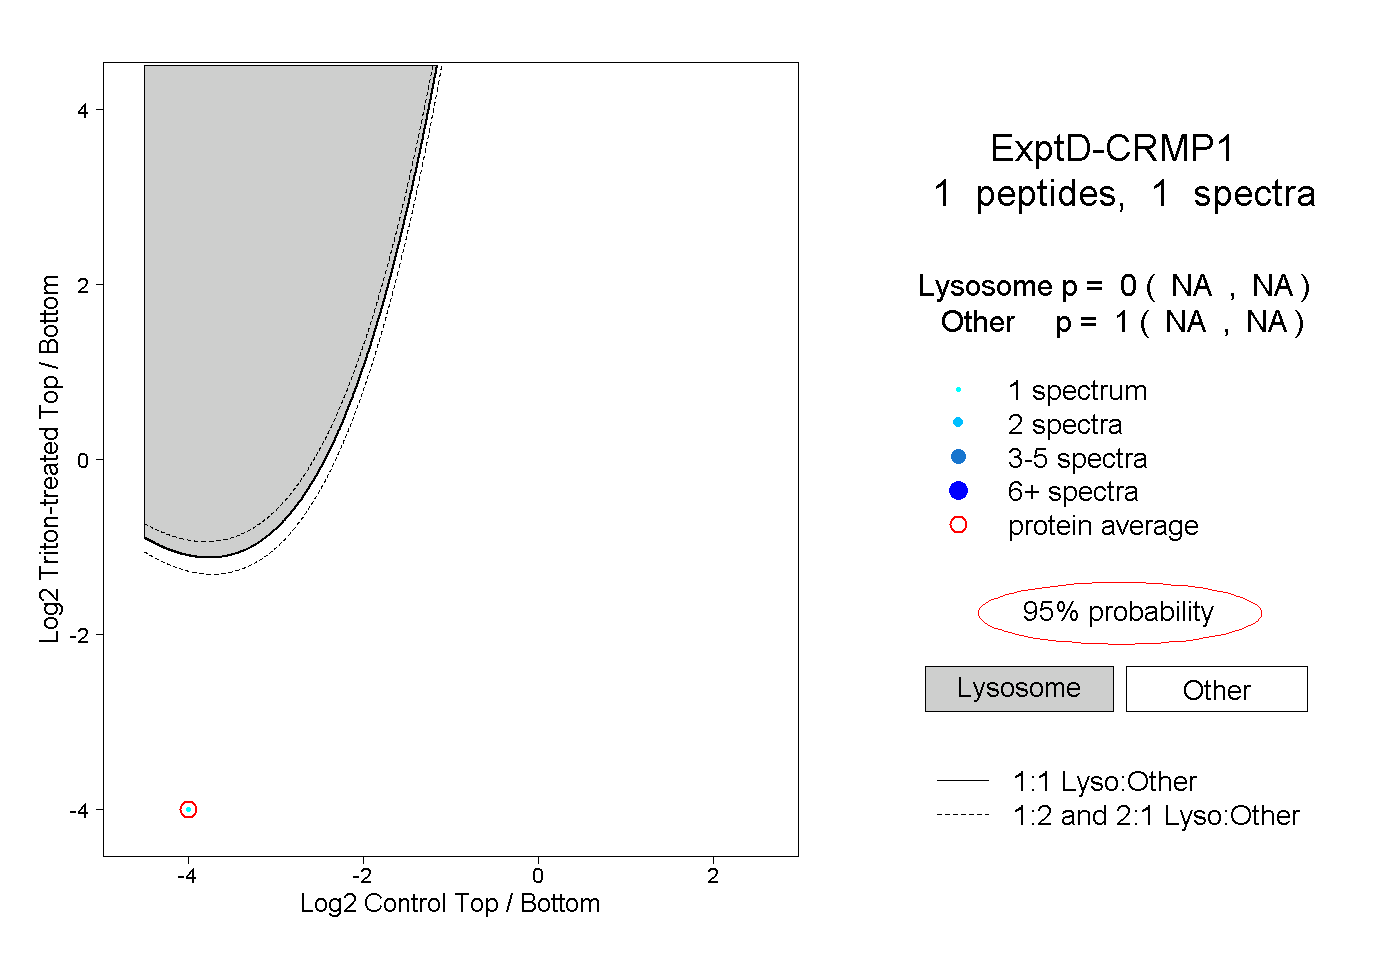
NA | NA
NA | NA