 3
3peptides
spectra
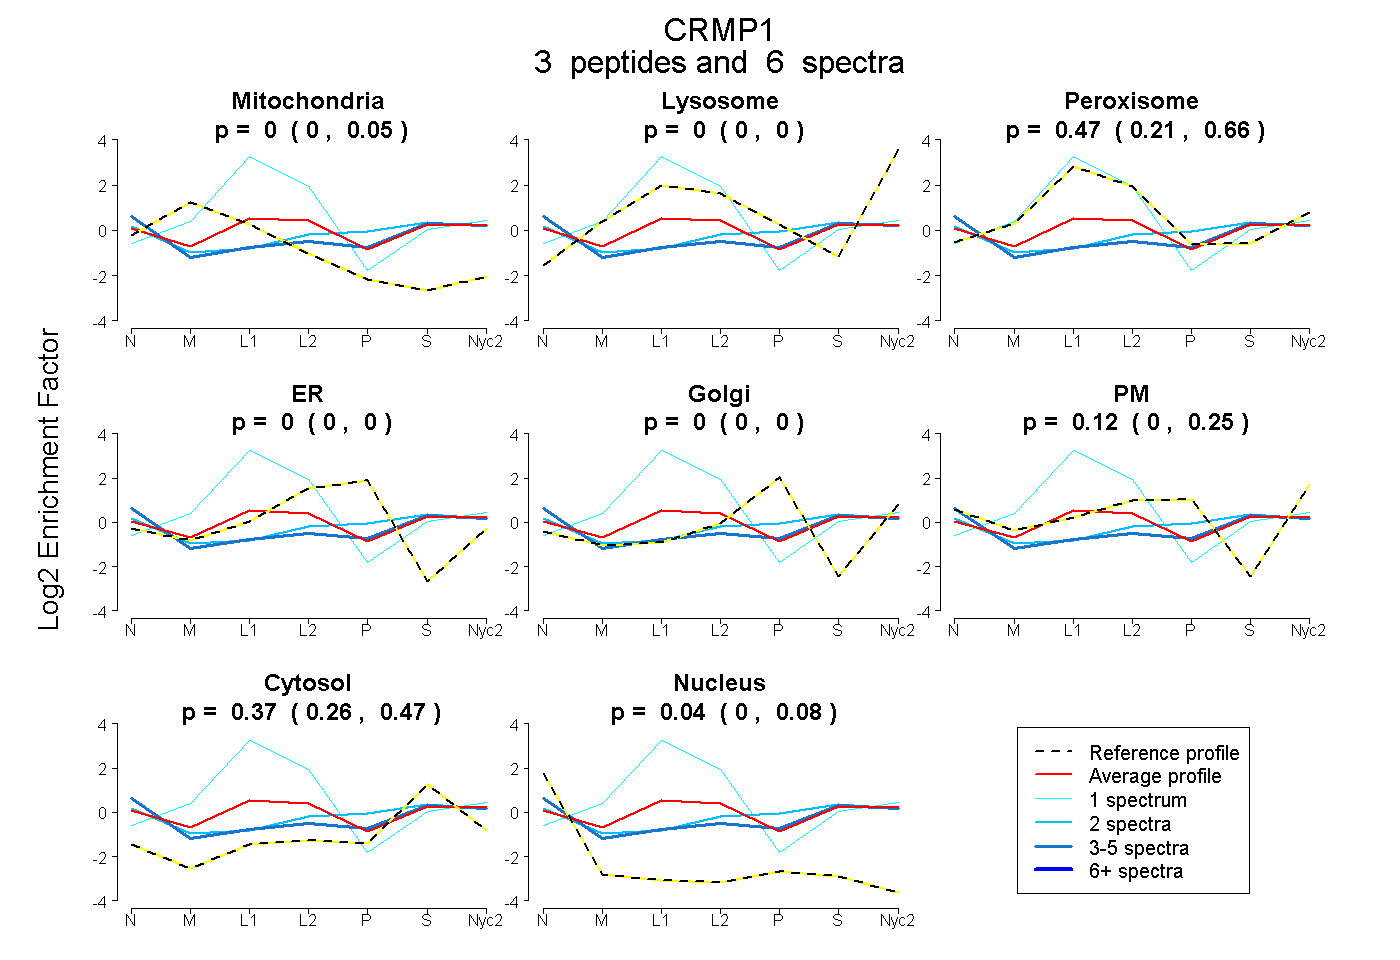
0.000 | 0.053
0.000 | 0.000
0.212 | 0.657
0.000 | 0.000
0.000 | 0.000
0.000 | 0.251
0.256 | 0.472
0.000 | 0.081
| Plot | Mito | Lyso | Perox | ER | Golgi | PM | Cytosol | Nucleus | |||||
| Expt A |
3 peptides |
6 spectra |
|
0.000 0.000 | 0.053 |
0.000 0.000 | 0.000 |
0.470 0.212 | 0.657 |
0.000 0.000 | 0.000 |
0.000 0.000 | 0.000 |
0.119 0.000 | 0.251 |
0.366 0.256 | 0.472 |
0.045 0.000 | 0.081 |
| 3 spectra, VFGLHSVSR | 0.000 | 0.000 | 0.096 | 0.000 | 0.000 | 0.327 | 0.500 | 0.077 | ||
| 1 spectrum, AIAIAGR | 0.013 | 0.000 | 0.982 | 0.000 | 0.000 | 0.000 | 0.005 | 0.000 | ||
| 2 spectra, KPFPEHLYQR | 0.000 | 0.000 | 0.036 | 0.000 | 0.000 | 0.422 | 0.542 | 0.000 |
| Plot | Mito | Lyso or Perox | ER | Golgi | PM | Cytosol | Nucleus | ||||||
| Expt B |
1 peptide |
3 spectra |
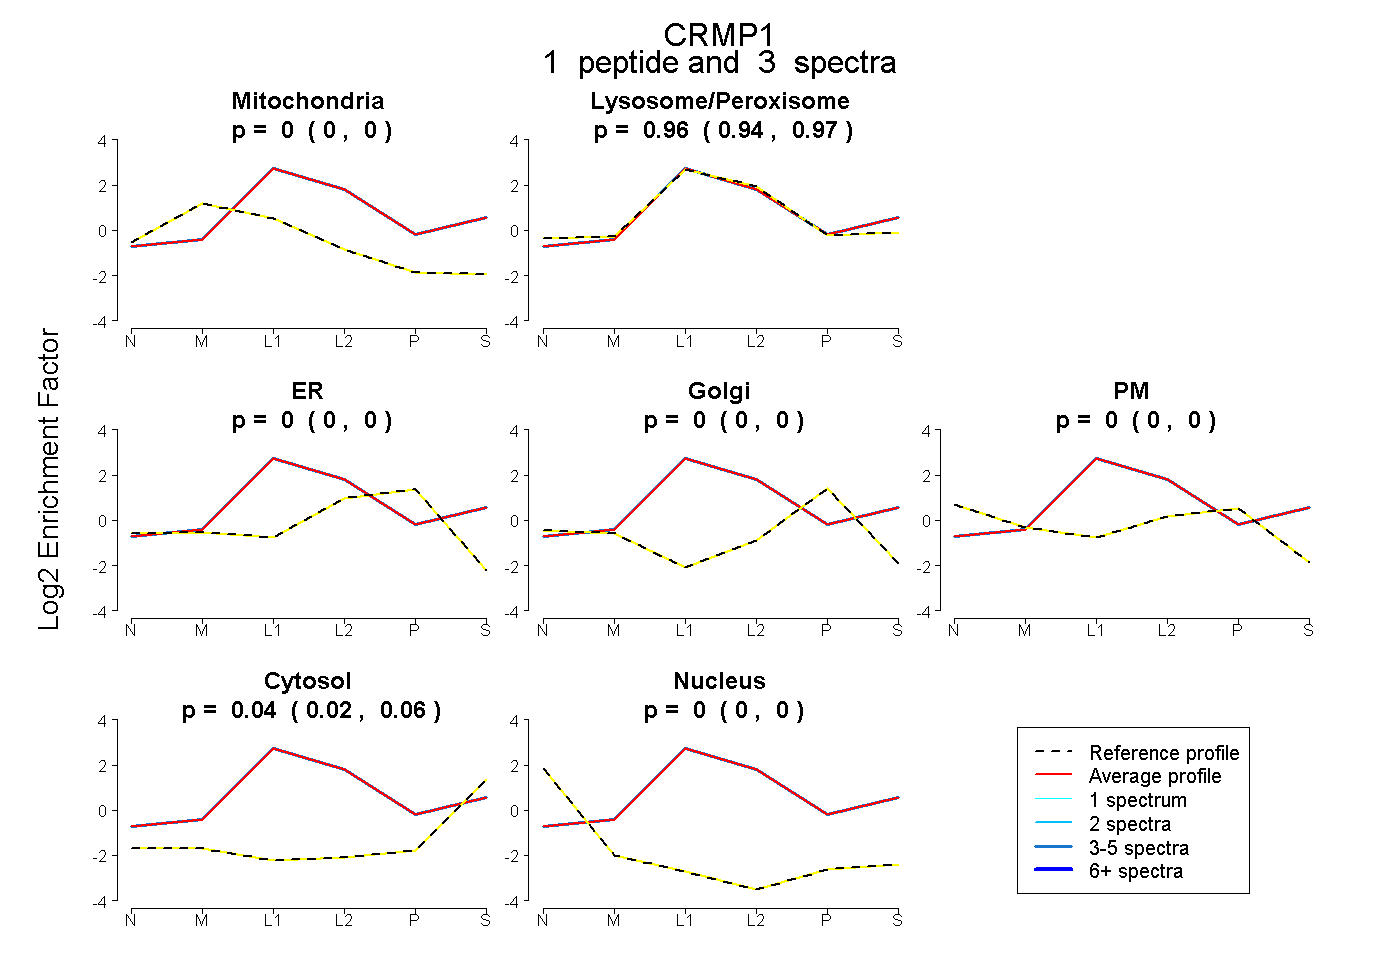 |
0.000 0.000 | 0.000 |
0.957 0.939 | 0.972 |
0.000 0.000 | 0.000 |
0.000 0.000 | 0.000 |
0.000 0.000 | 0.000 |
0.043 0.025 | 0.057 |
0.000 0.000 | 0.000 |
|||
| Plot | Lyso | Other | |||||||||||
| Expt C |
1 peptide |
1 spectrum |
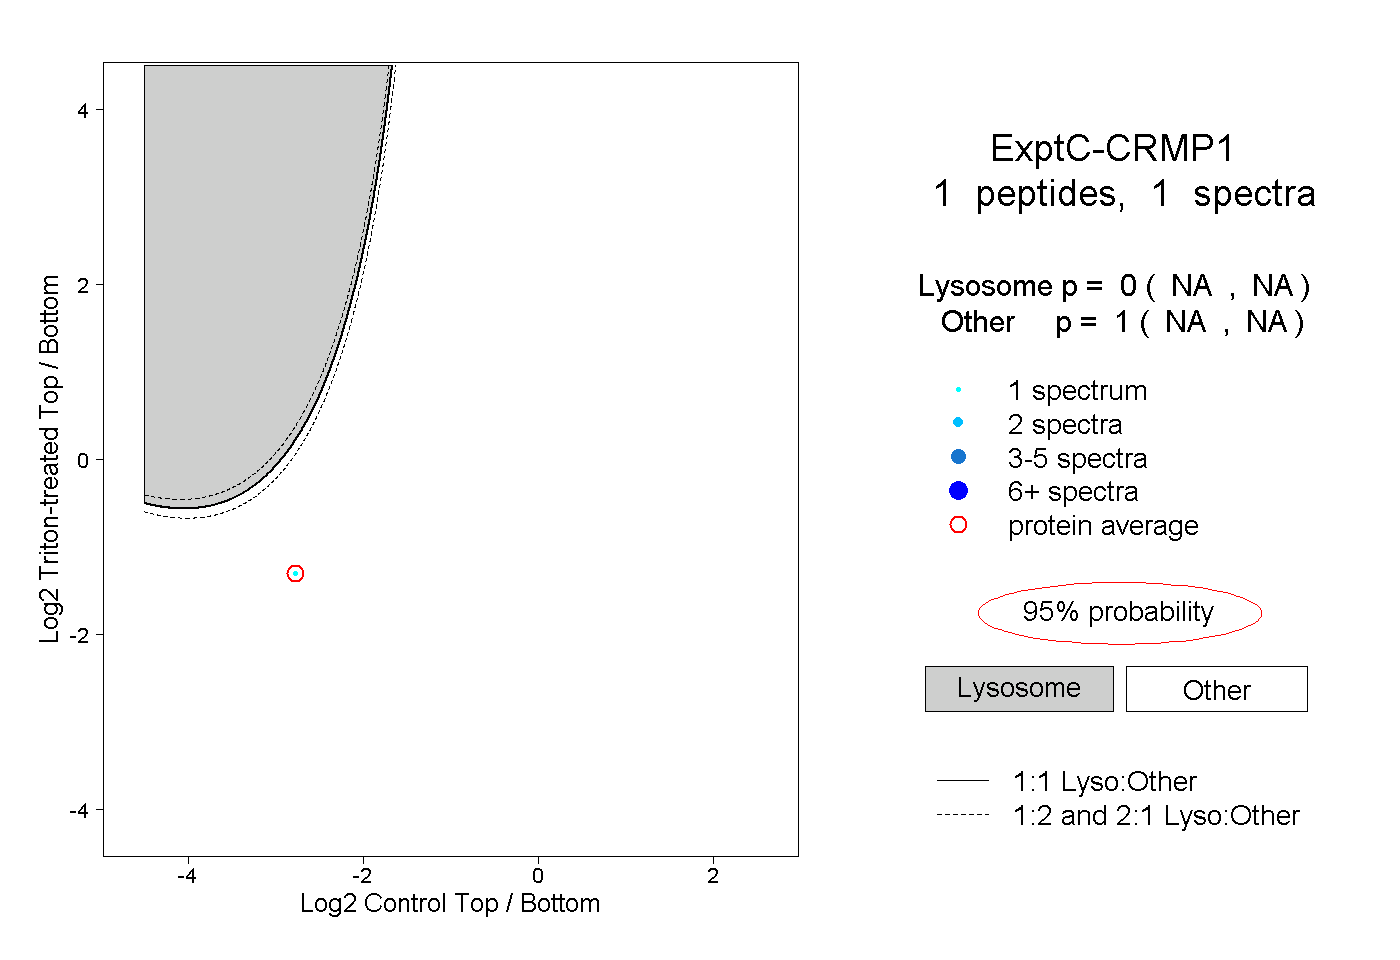 |
0.000 NA | NA |
1.000 NA | NA |
||||||||
| Plot | Lyso | Other | |||||||||||
| Expt D |
1 peptide |
1 spectrum |
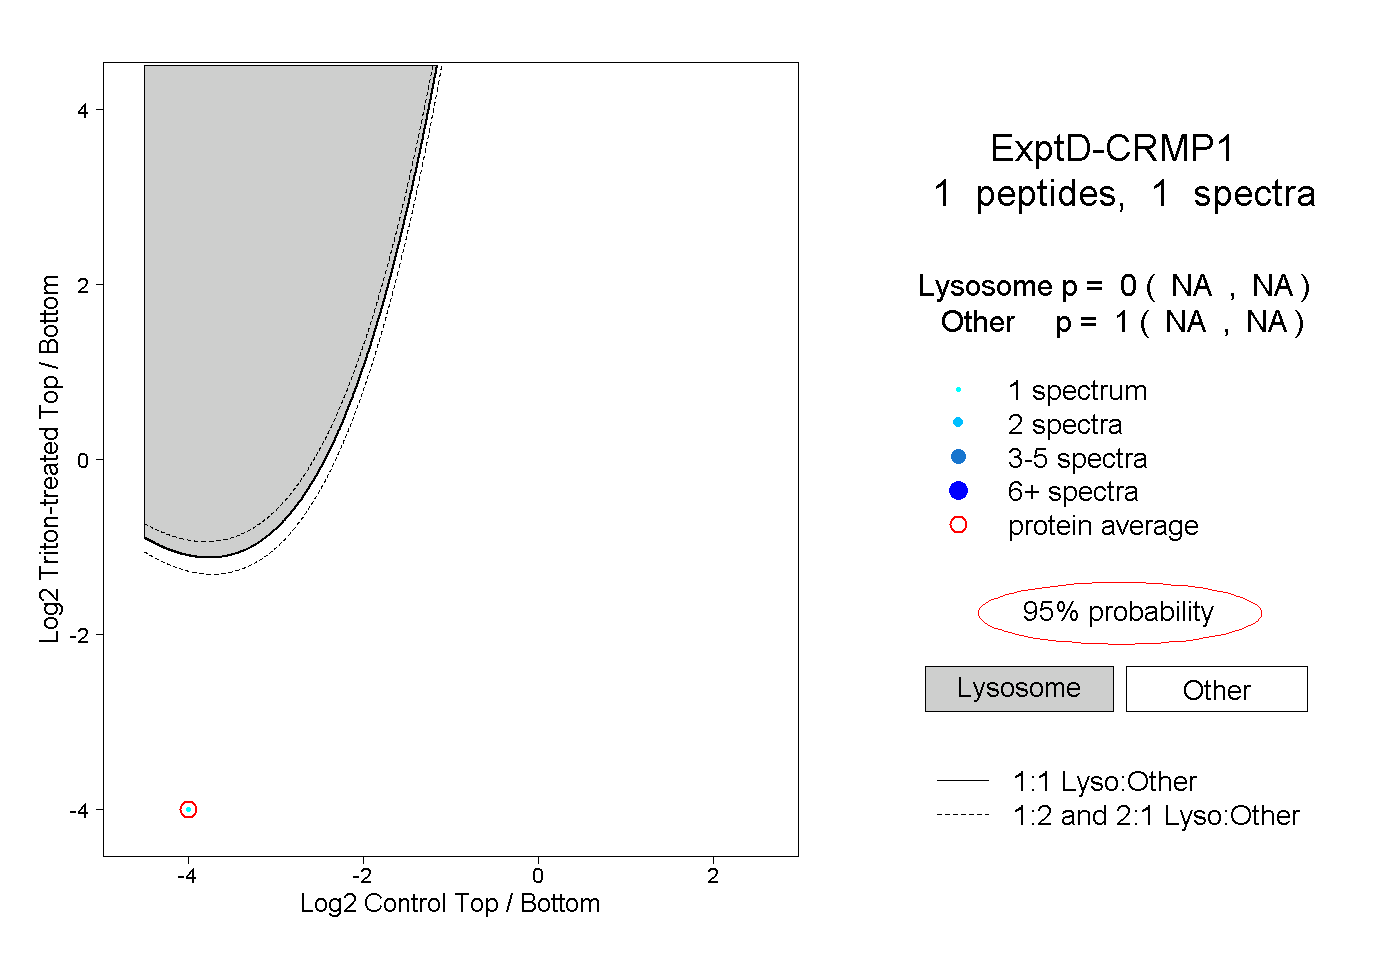 |
0.000 NA | NA |
1.000 NA | NA |