 29
29peptides
spectra
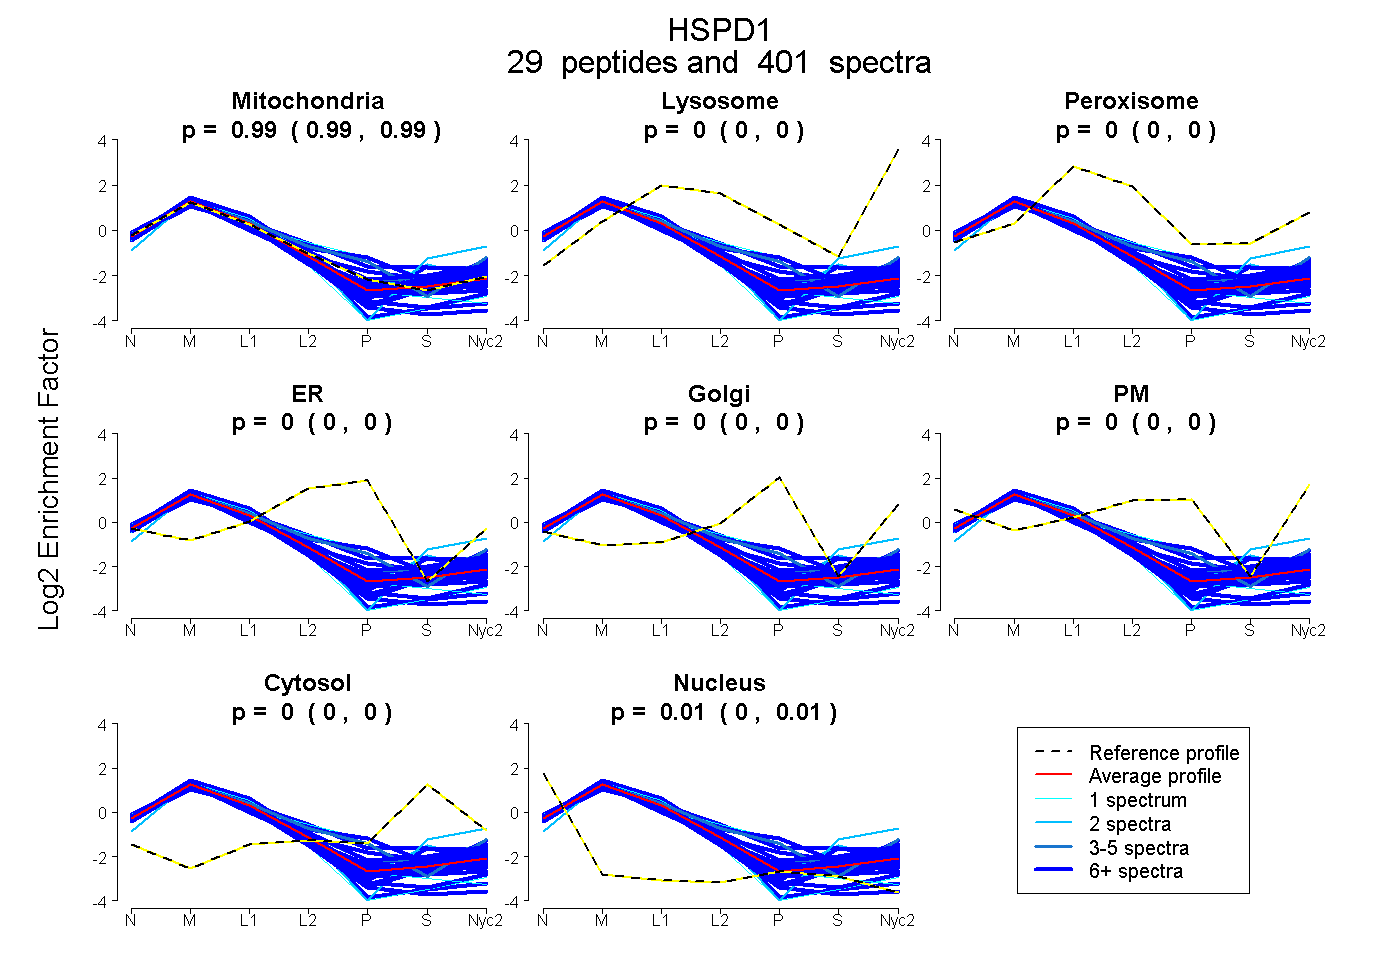
0.990 | 0.992
0.000 | 0.000
0.000 | 0.000
0.000 | 0.000
0.000 | 0.000
0.000 | 0.000
0.002 | 0.005
0.004 | 0.006
24peptides
spectra
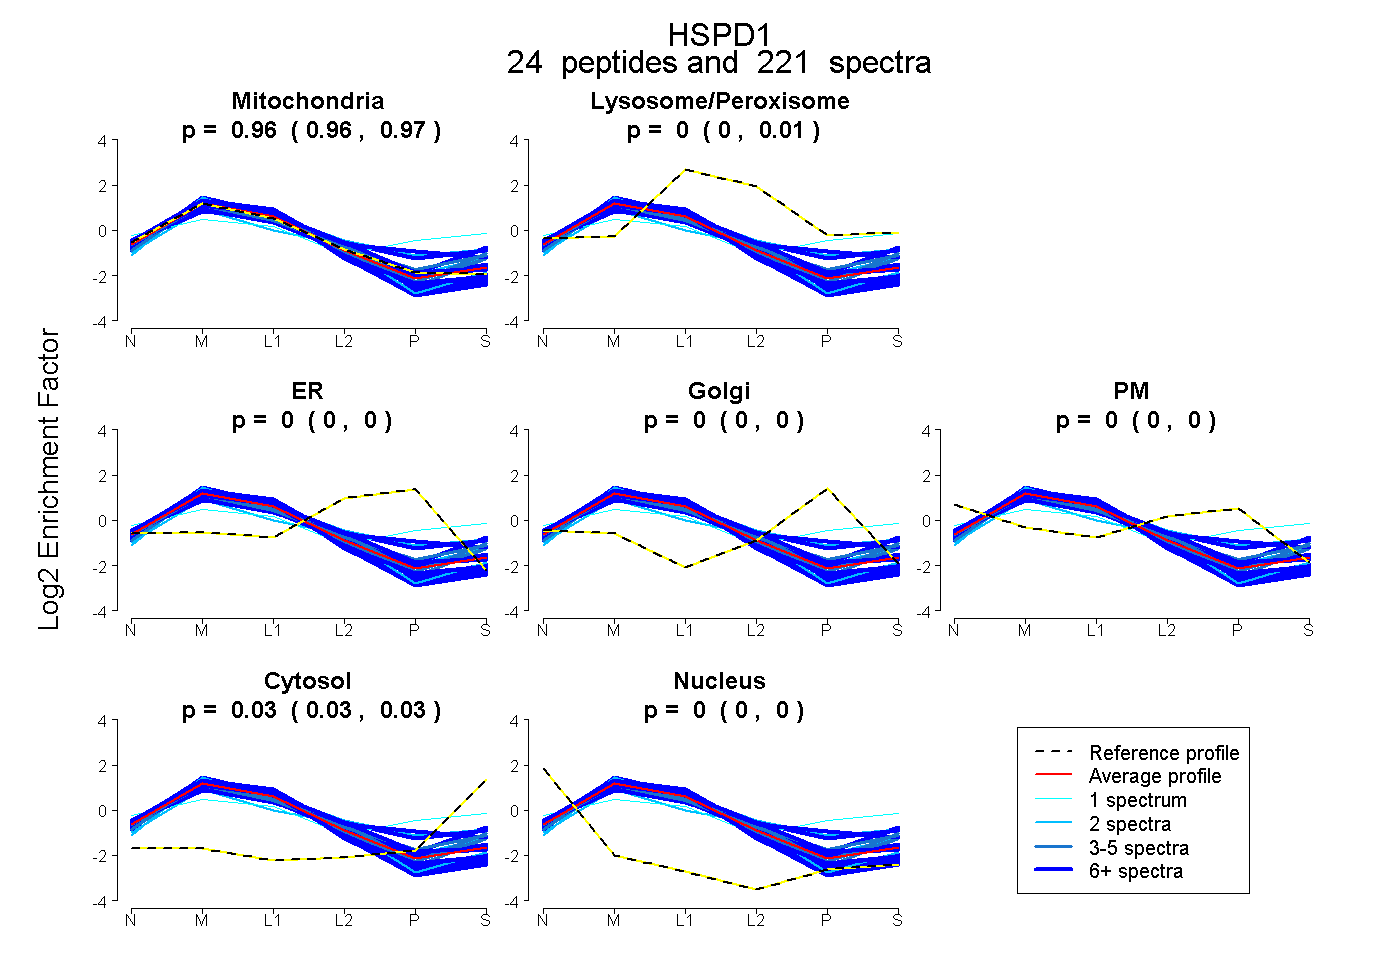
0.960 | 0.966
0.003 | 0.006
0.000 | 0.000
0.000 | 0.000
0.000 | 0.000
0.030 | 0.033
0.000 | 0.000
28peptides
spectra
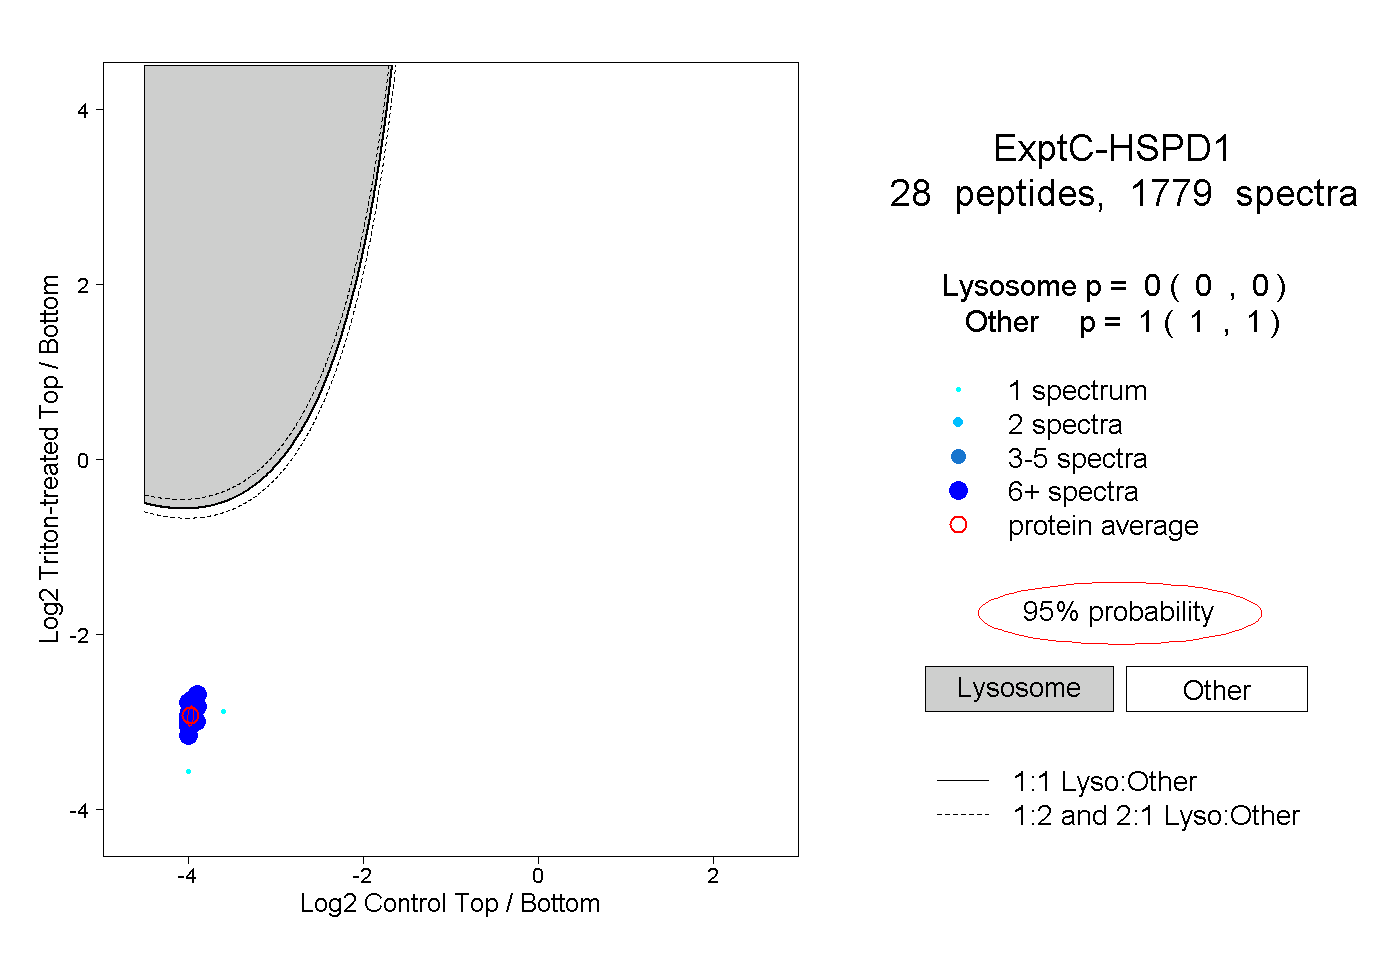
0.000 | 0.000
1.000 | 1.000
19peptides
spectra
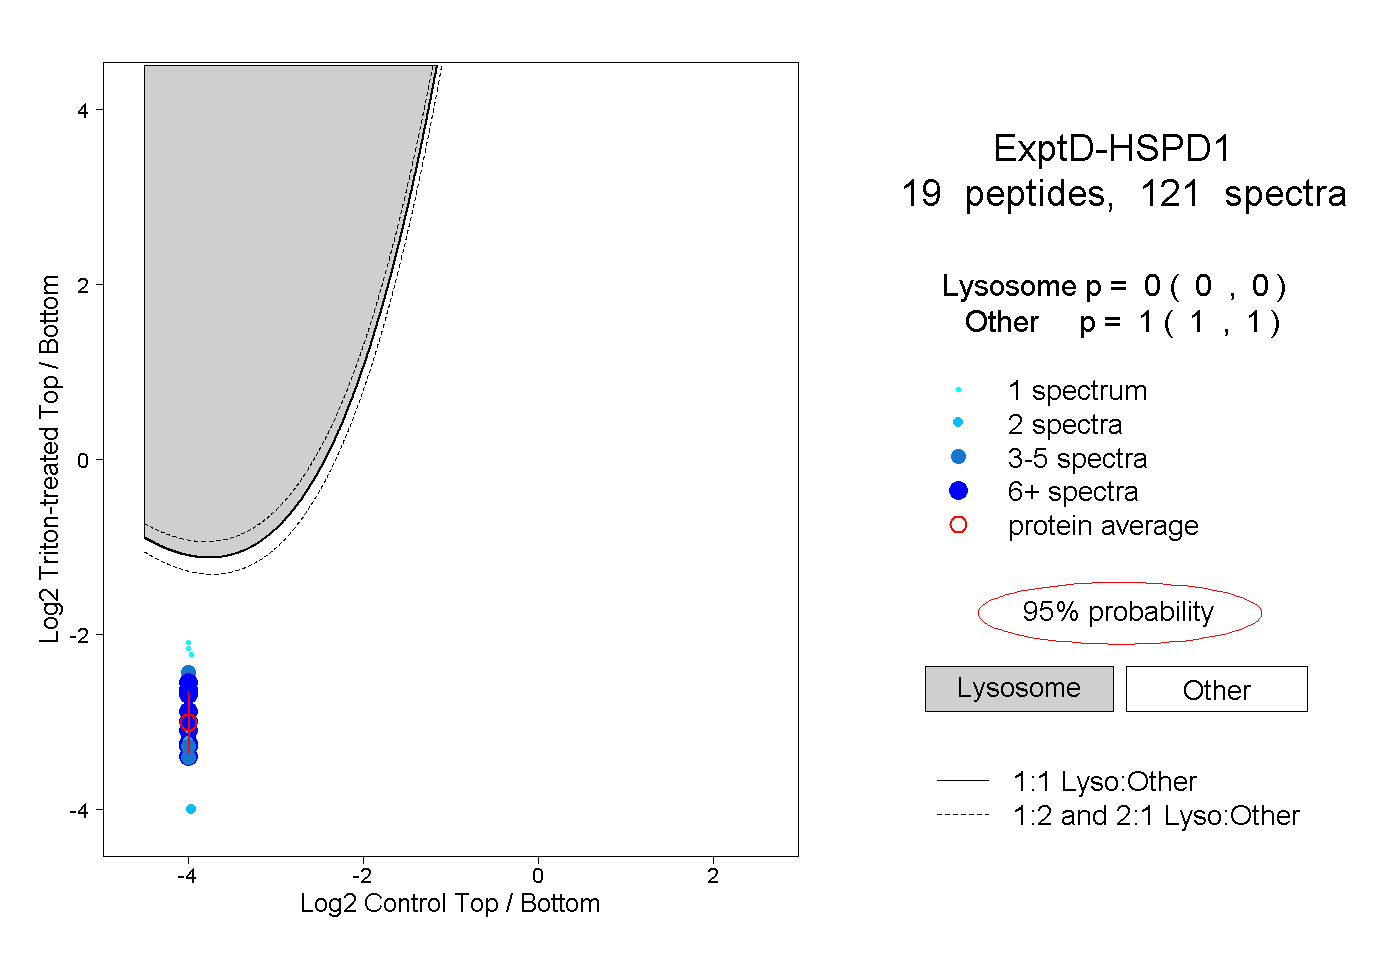
0.000 | 0.000
1.000 | 1.000