 8
8peptides
spectra
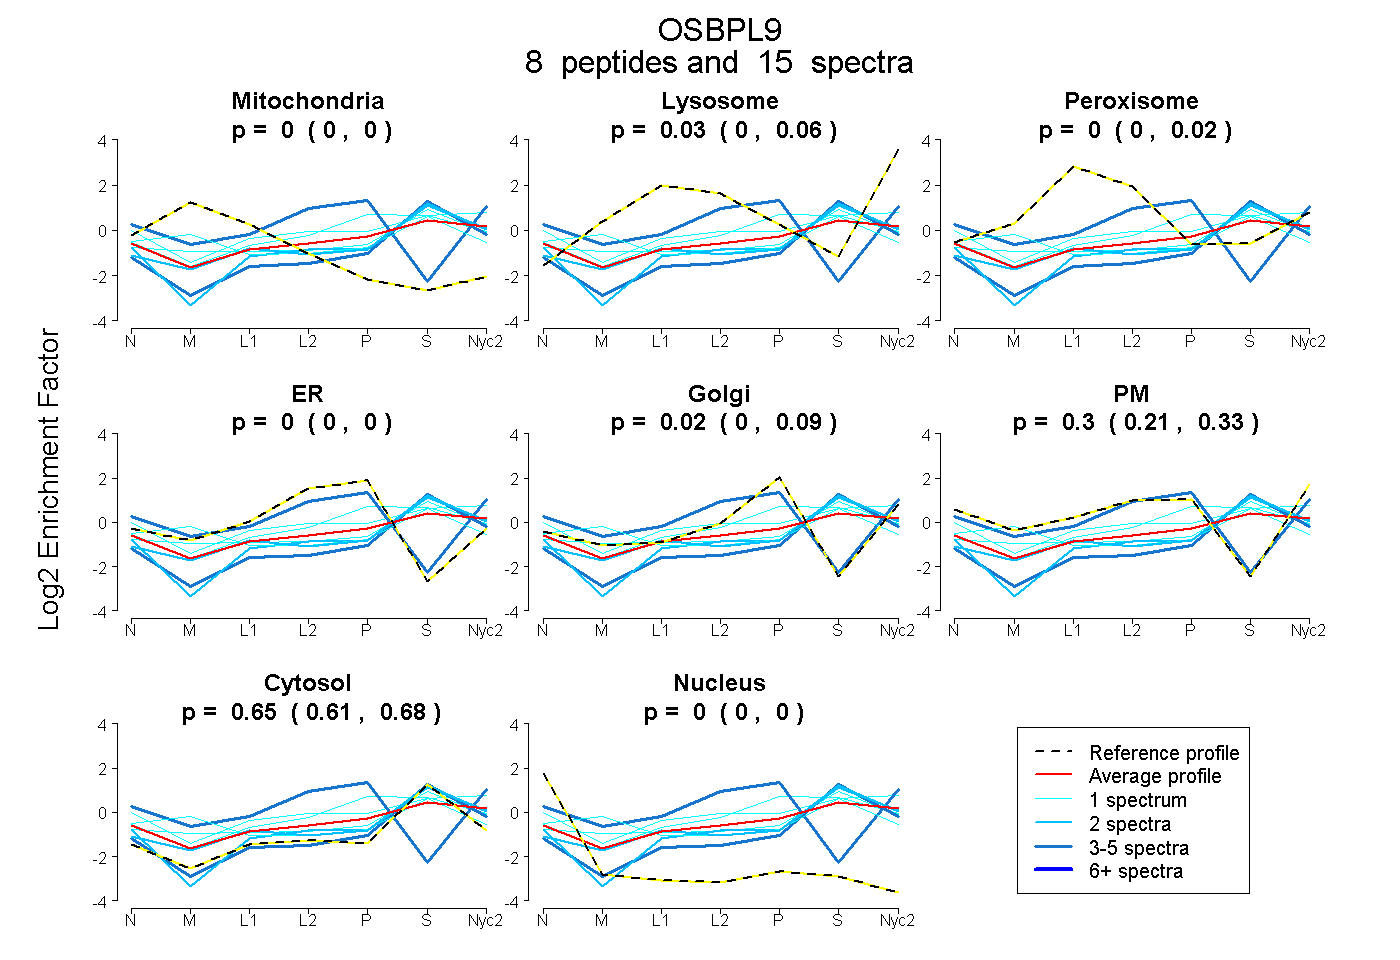
0.000 | 0.000
0.000 | 0.061
0.000 | 0.021
0.000 | 0.000
0.000 | 0.089
0.210 | 0.335
0.615 | 0.680
0.000 | 0.000
1peptide
spectrum
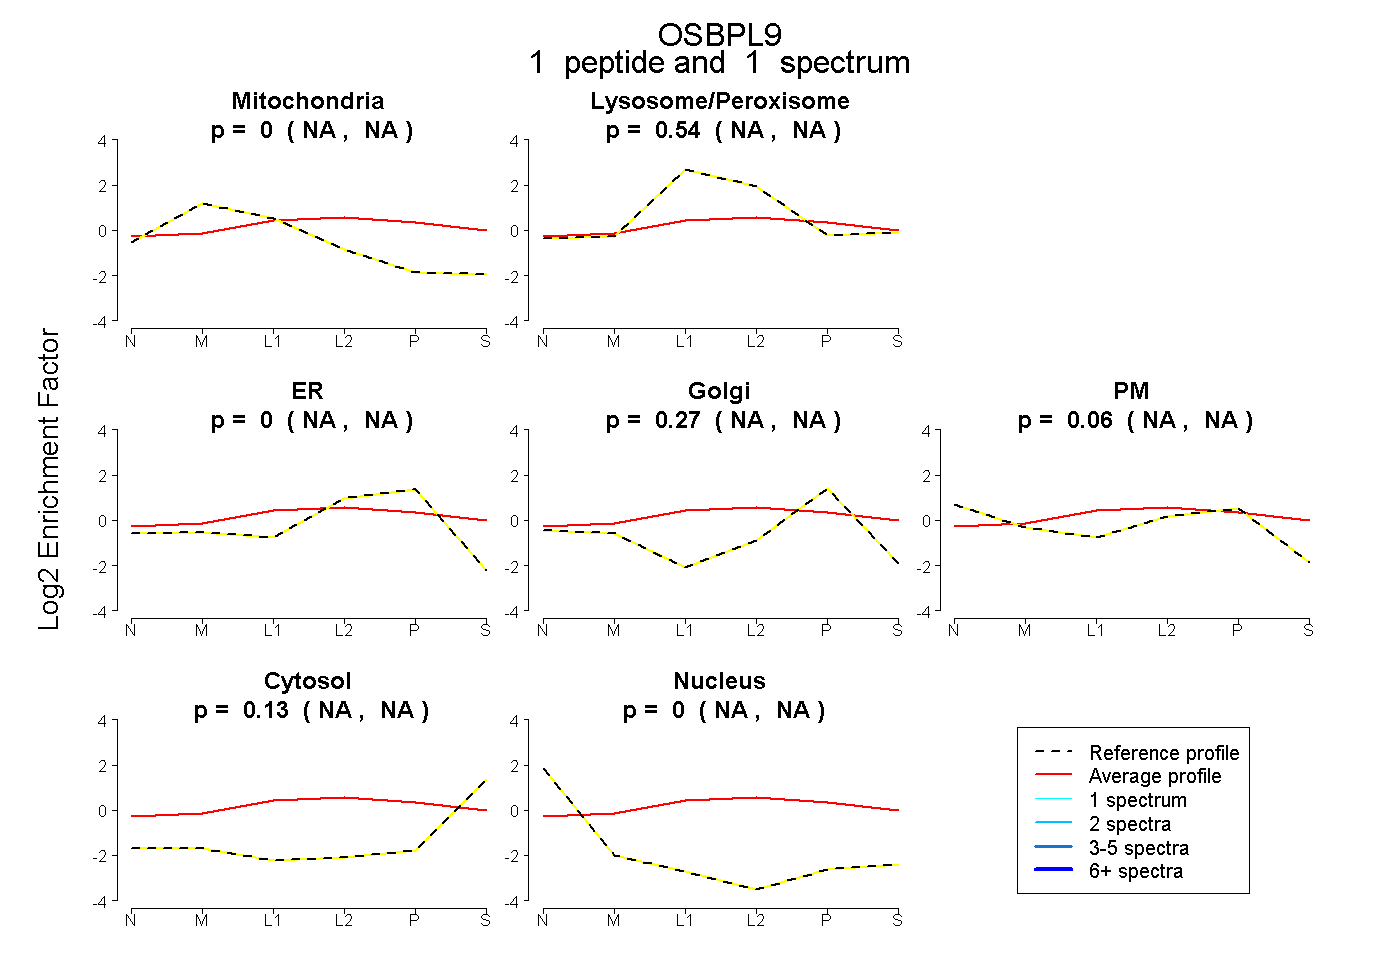
NA | NA
NA | NA
NA | NA
NA | NA
NA | NA
NA | NA
NA | NA
4peptides
spectra
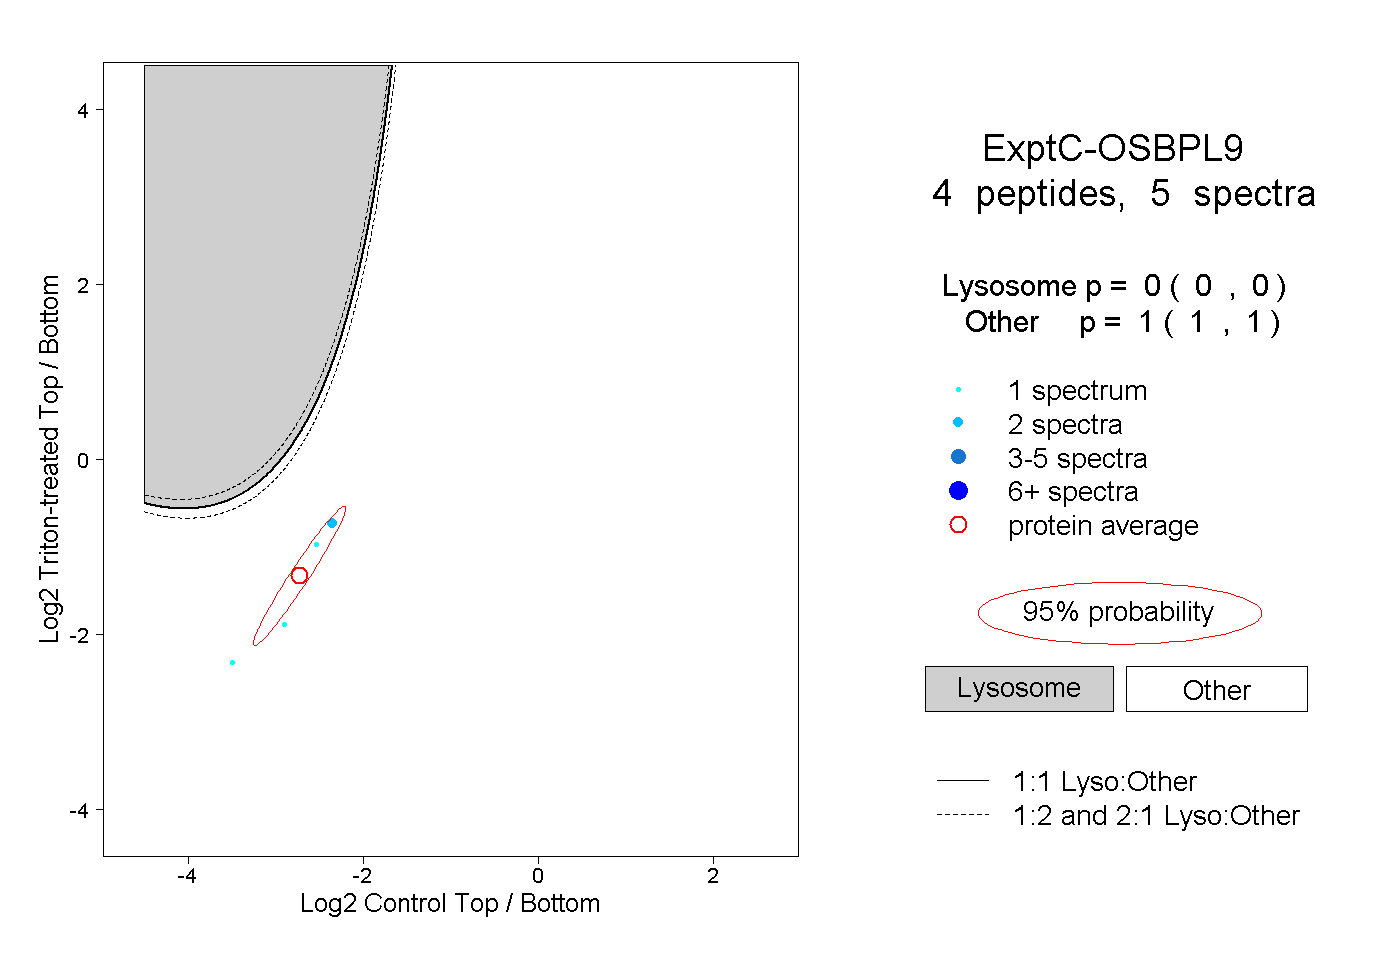
0.000 | 0.000
1.000 | 1.000
1peptide
spectra
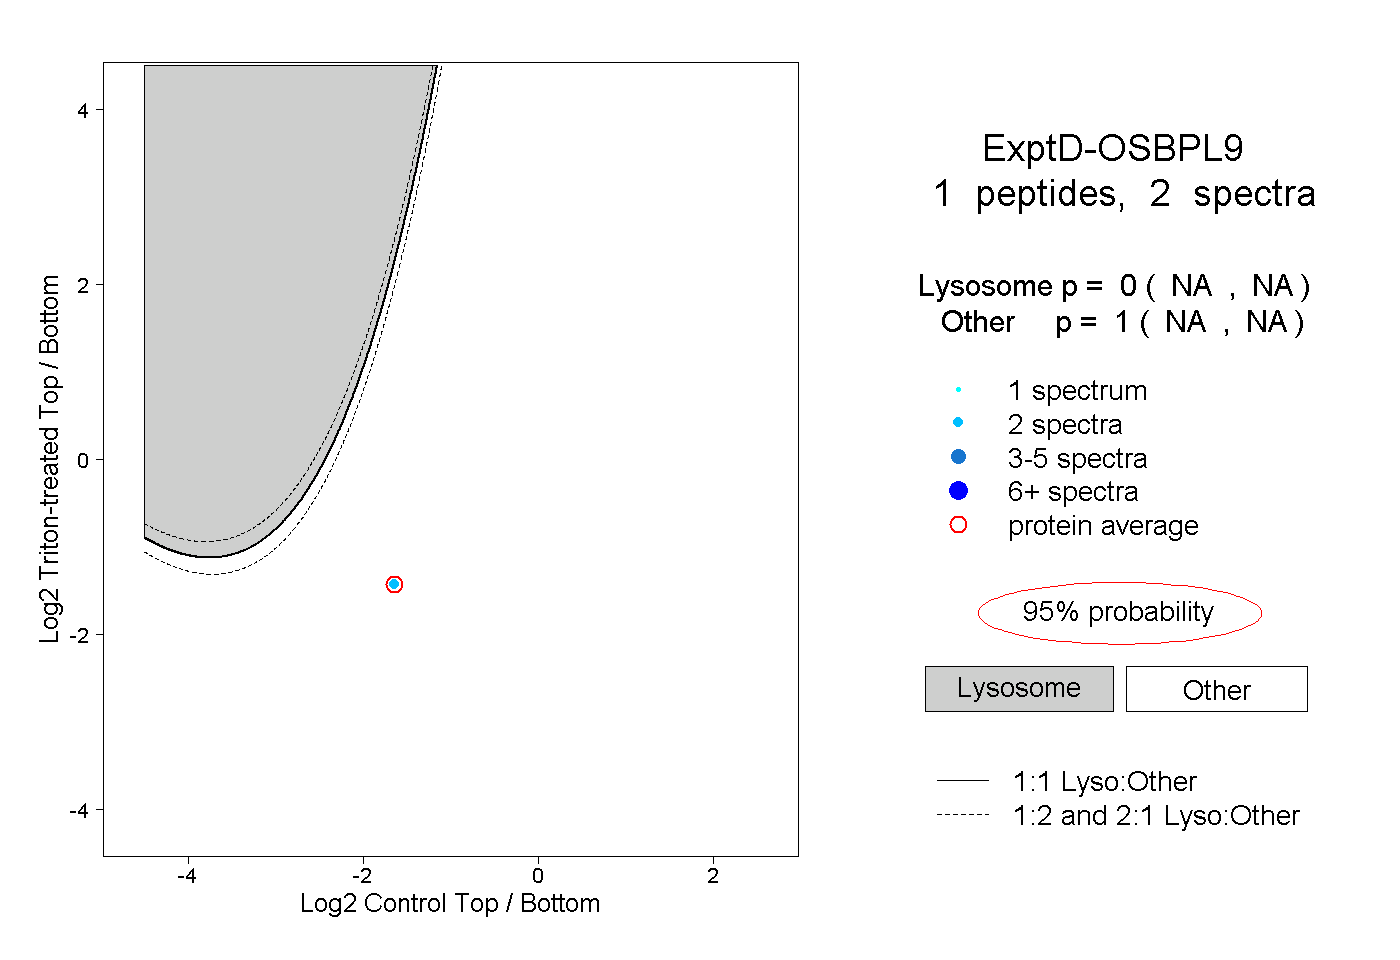
NA | NA
NA | NA