 8
8peptides
spectra
0.000 | 0.000
0.000 | 0.061
0.000 | 0.021
0.000 | 0.000
0.000 | 0.089
0.210 | 0.335
0.615 | 0.680
0.000 | 0.000
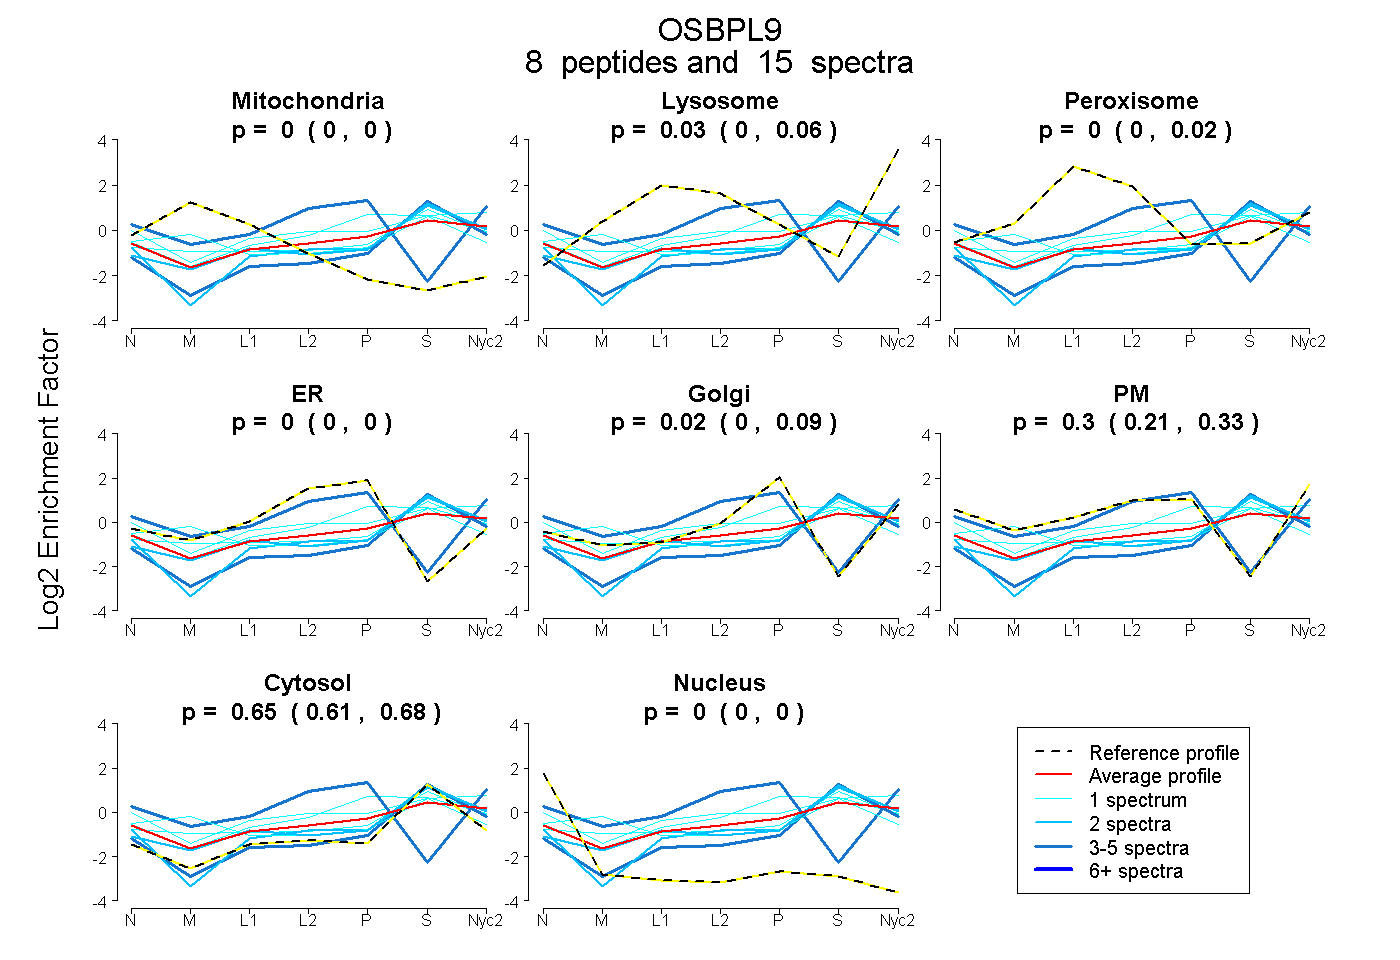
| Plot | Mito | Lyso | Perox | ER | Golgi | PM | Cytosol | Nucleus | |||||
| Expt A |
8 peptides |
15 spectra |
|
0.000 0.000 | 0.000 |
0.032 0.000 | 0.061 |
0.000 0.000 | 0.021 |
0.000 0.000 | 0.000 |
0.017 0.000 | 0.089 |
0.298 0.210 | 0.335 |
0.654 0.615 | 0.680 |
0.000 0.000 | 0.000 |
| 4 spectra, LPIIK | 0.000 | 0.000 | 0.000 | 0.220 | 0.141 | 0.600 | 0.039 | 0.000 | ||
| 3 spectra, VVLPTFILER | 0.000 | 0.000 | 0.000 | 0.000 | 0.049 | 0.000 | 0.951 | 0.000 | ||
| 1 spectrum, WYLSAFHAGR | 0.239 | 0.052 | 0.000 | 0.000 | 0.000 | 0.118 | 0.591 | 0.000 | ||
| 2 spectra, WIHALEETILR | 0.000 | 0.000 | 0.000 | 0.000 | 0.000 | 0.113 | 0.887 | 0.000 | ||
| 1 spectrum, DIDAATEAK | 0.000 | 0.000 | 0.127 | 0.025 | 0.327 | 0.000 | 0.521 | 0.000 | ||
| 1 spectrum, EIQWETR | 0.000 | 0.080 | 0.061 | 0.000 | 0.000 | 0.325 | 0.535 | 0.000 | ||
| 2 spectra, YATGENTVFVDTK | 0.000 | 0.157 | 0.000 | 0.000 | 0.000 | 0.032 | 0.811 | 0.000 | ||
| 1 spectrum, MVQVVK | 0.067 | 0.105 | 0.010 | 0.000 | 0.000 | 0.119 | 0.699 | 0.000 |
| Plot | Mito | Lyso or Perox | ER | Golgi | PM | Cytosol | Nucleus | ||||||
| Expt B |
1 peptide |
1 spectrum |
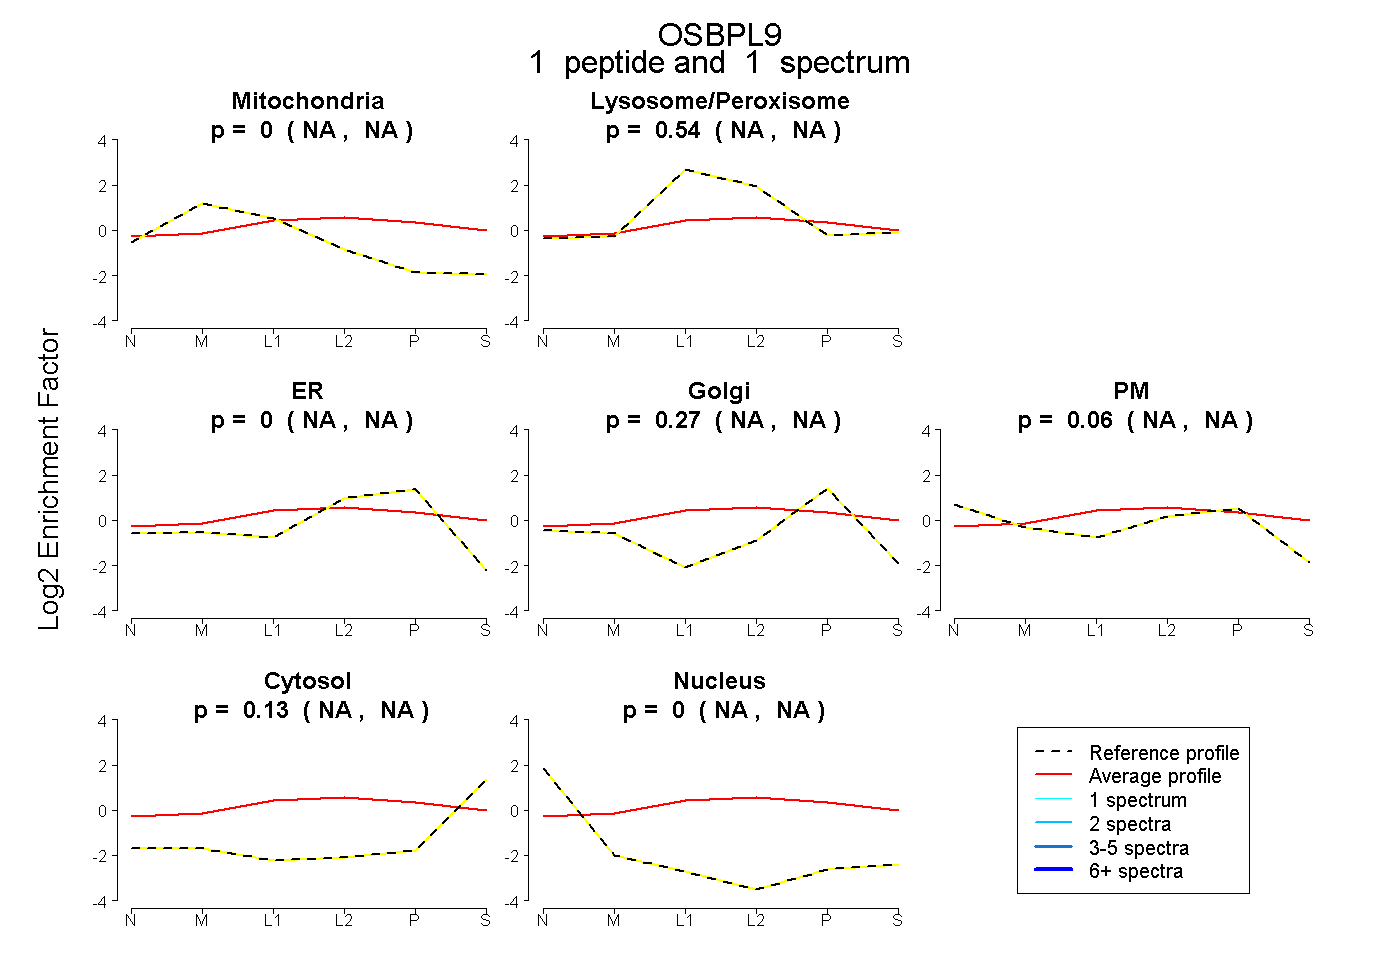 |
0.000 NA | NA |
0.541 NA | NA |
0.000 NA | NA |
0.269 NA | NA |
0.057 NA | NA |
0.133 NA | NA |
0.000 NA | NA |
|||
| Plot | Lyso | Other | |||||||||||
| Expt C |
4 peptides |
5 spectra |
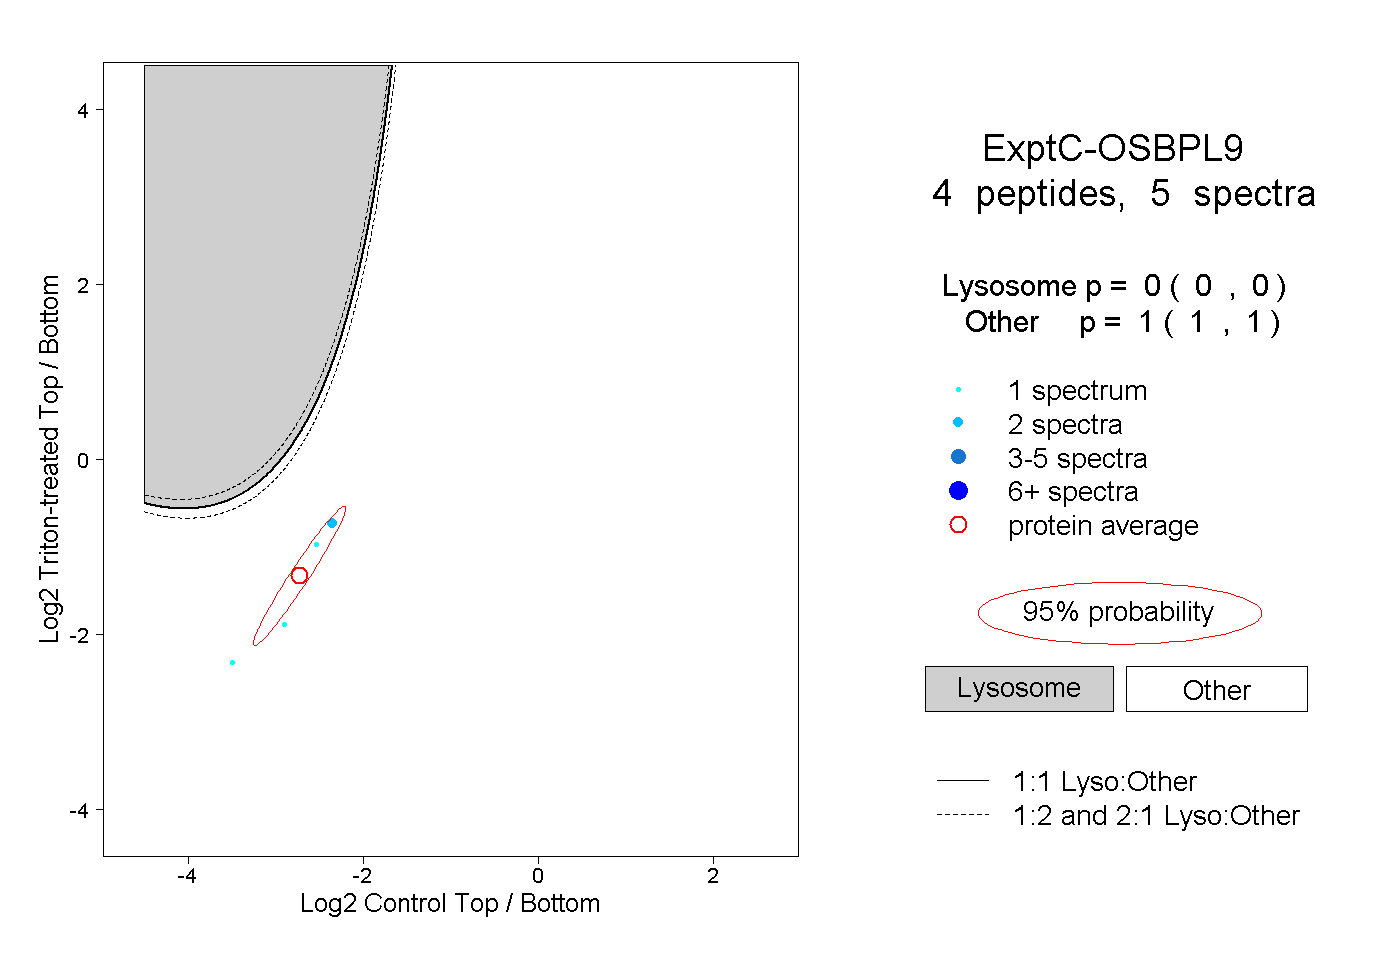 |
0.000 0.000 | 0.000 |
1.000 1.000 | 1.000 |
||||||||
| Plot | Lyso | Other | |||||||||||
| Expt D |
1 peptide |
2 spectra |
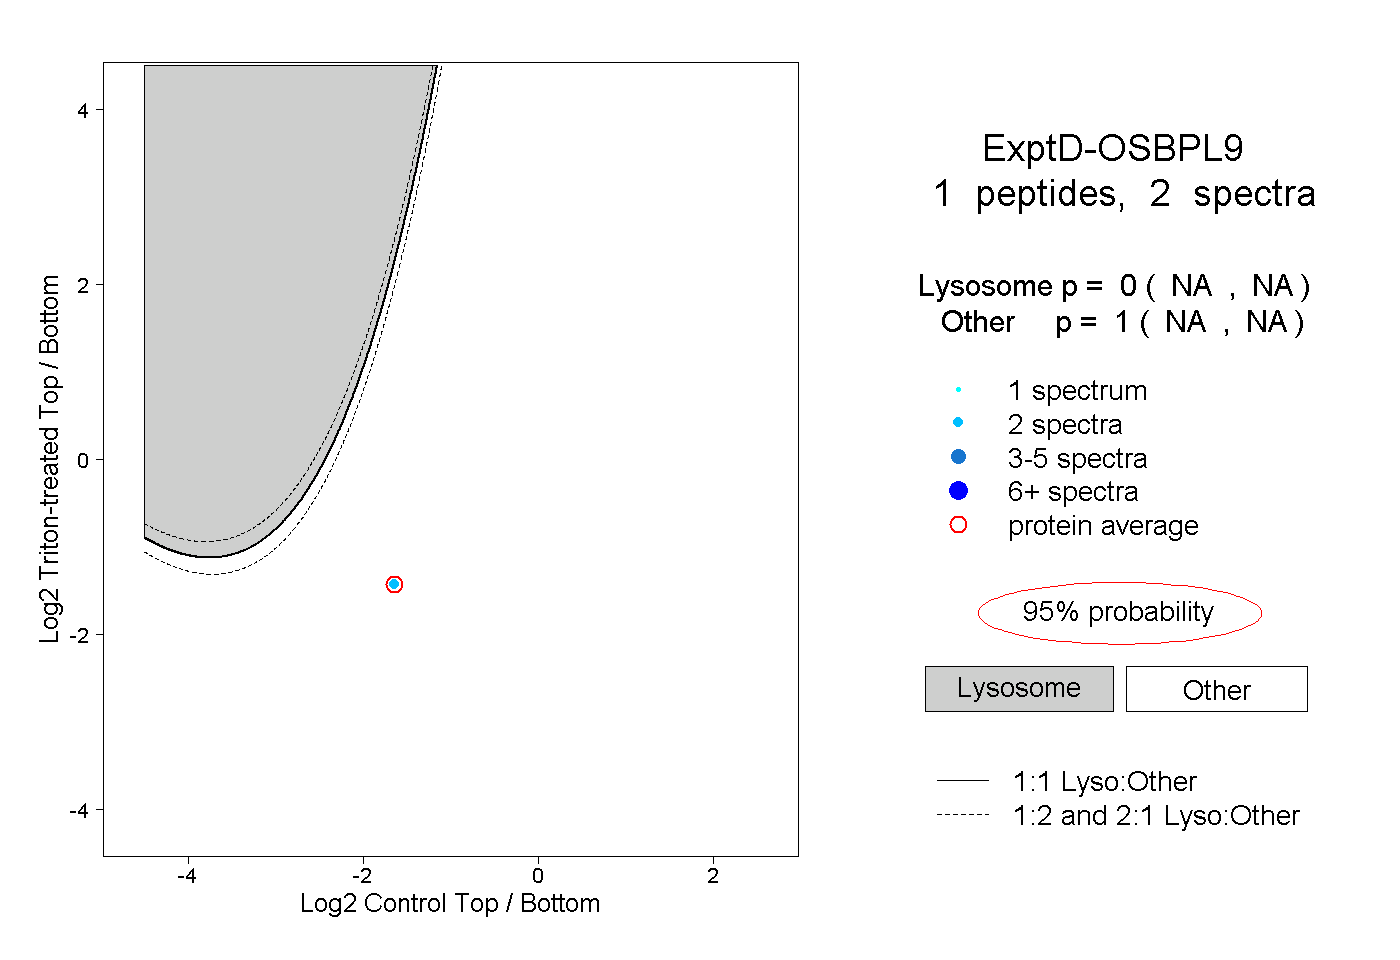 |
0.000 NA | NA |
1.000 NA | NA |