 8
8peptides
spectra
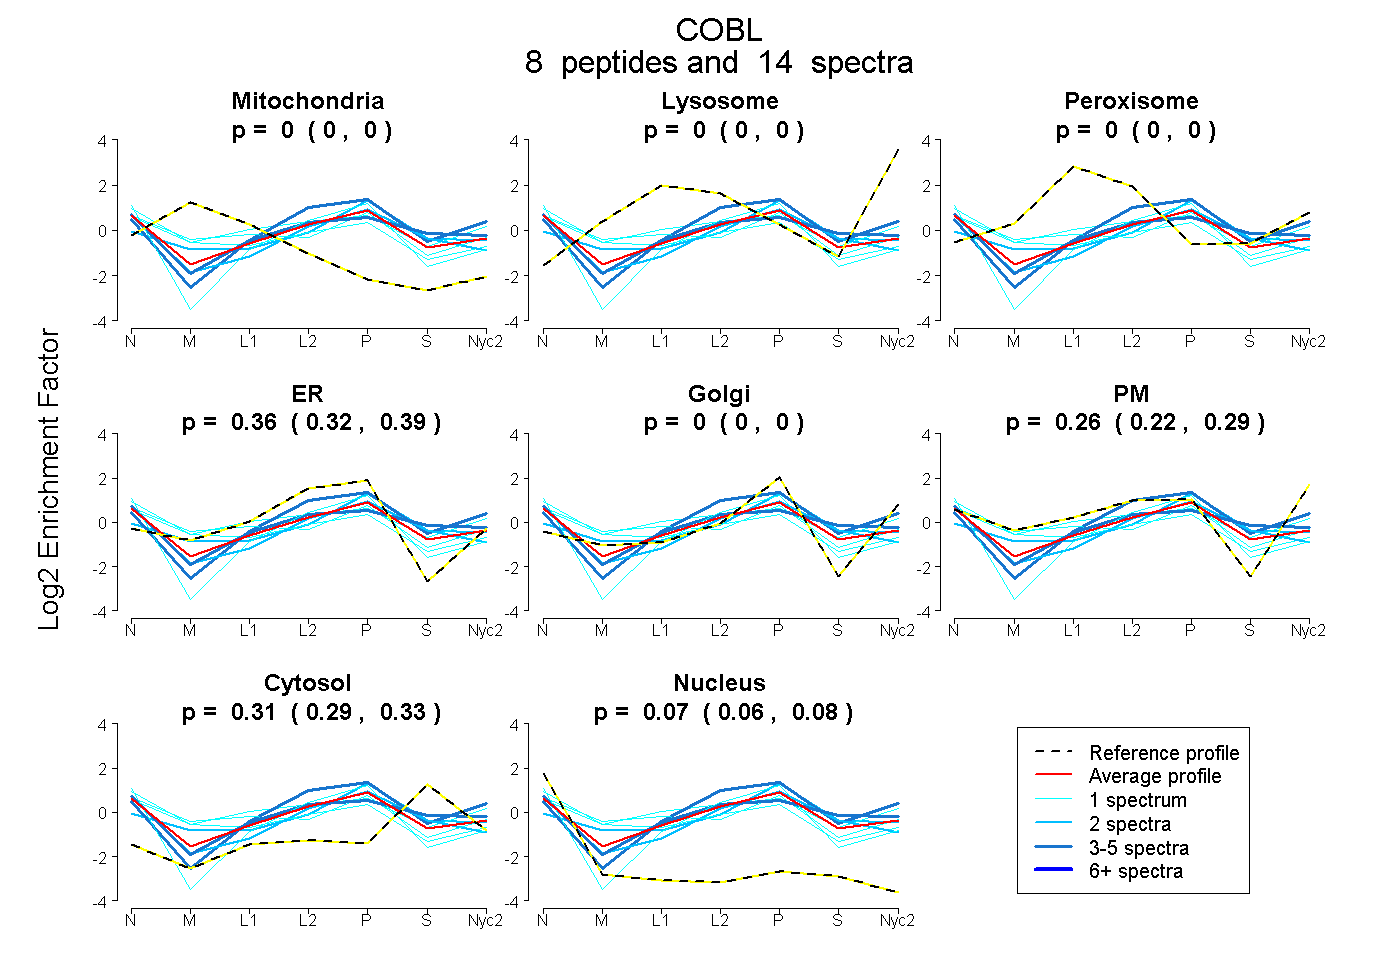
0.000 | 0.000
0.000 | 0.000
0.000 | 0.000
0.324 | 0.391
0.000 | 0.000
0.223 | 0.292
0.290 | 0.326
0.055 | 0.077
3peptides
spectra
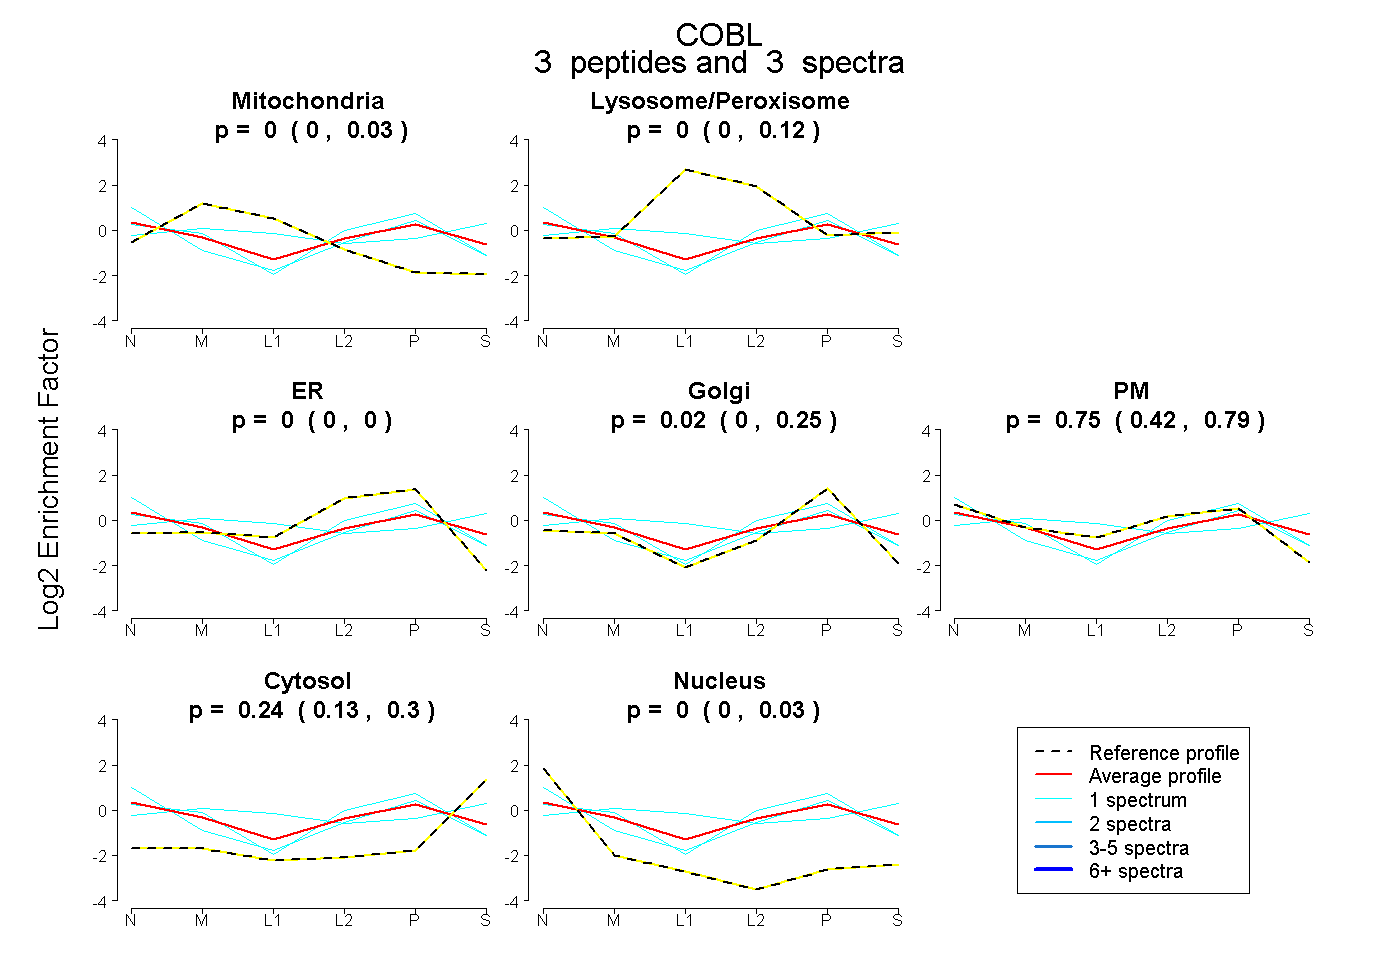
0.000 | 0.033
0.000 | 0.118
0.000 | 0.000
0.000 | 0.251
0.423 | 0.787
0.127 | 0.298
0.000 | 0.028
6peptides
spectra
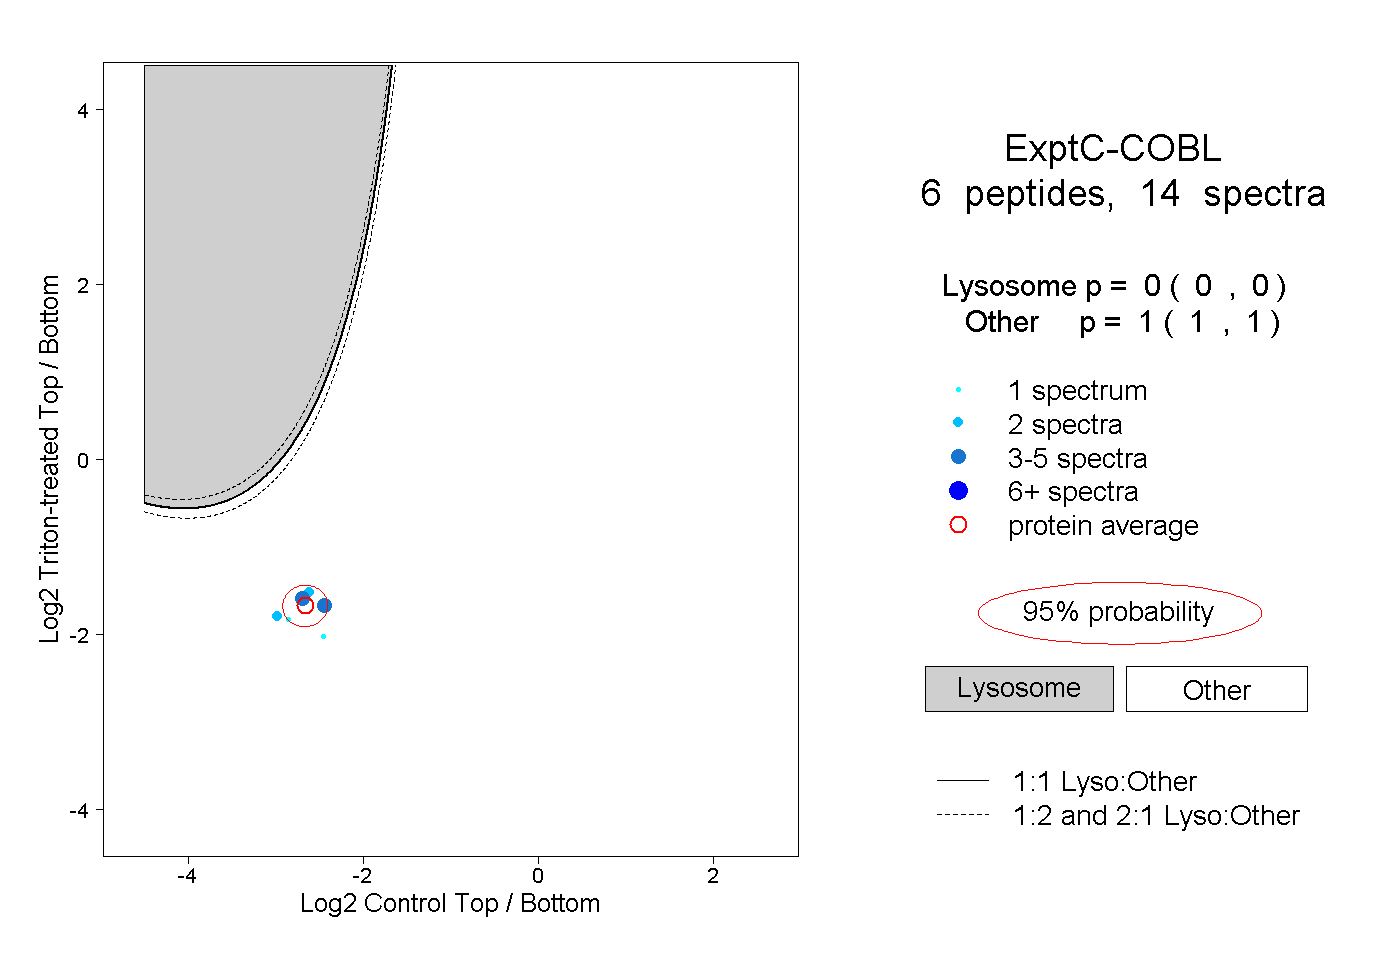
0.000 | 0.000
1.000 | 1.000
1peptide
spectrum
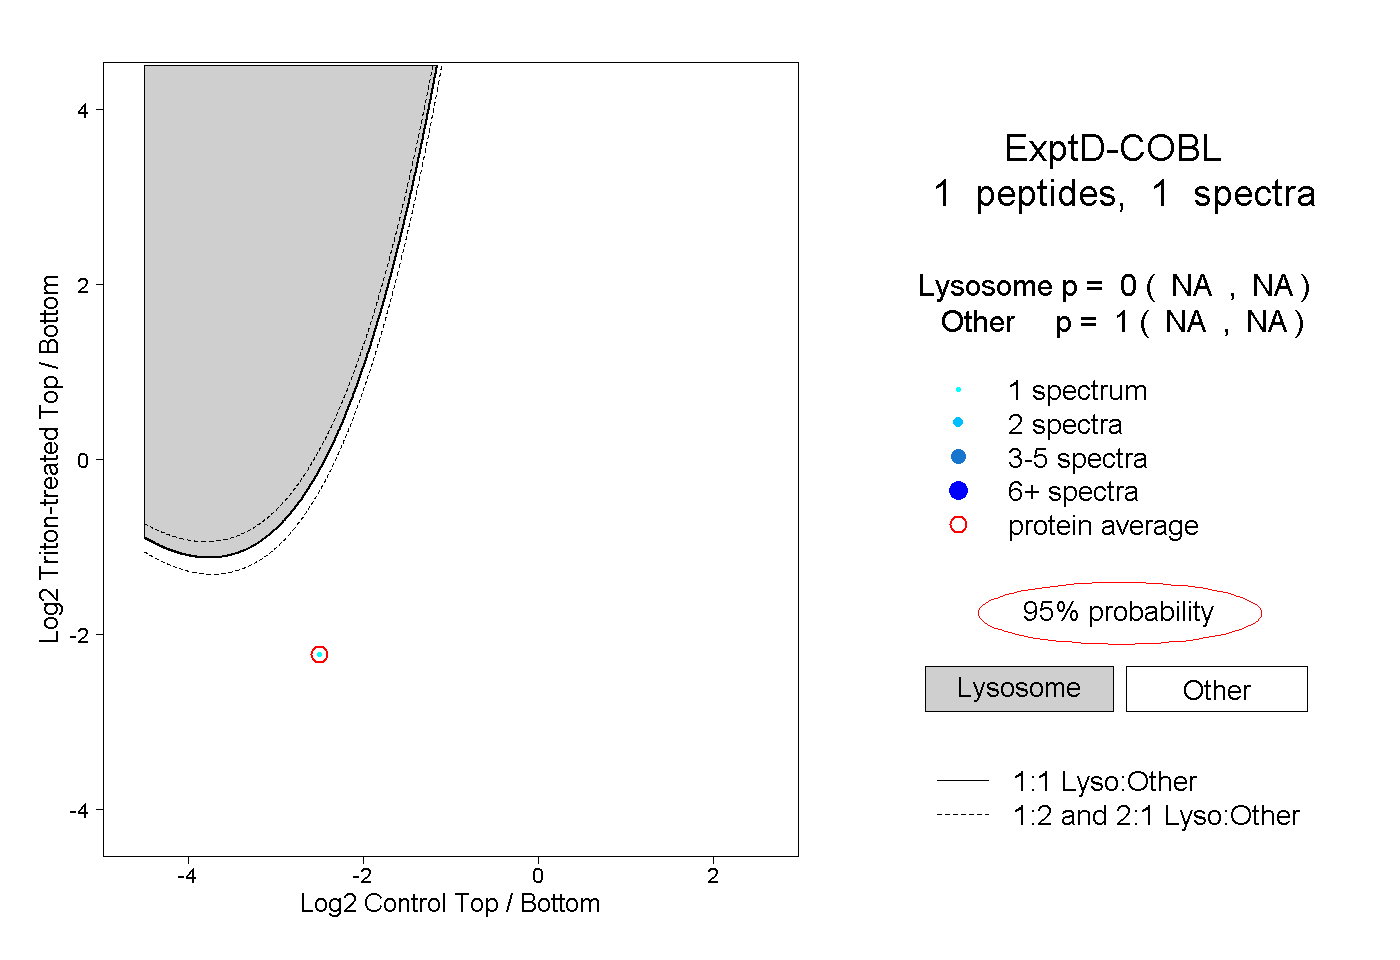
NA | NA
NA | NA