 8
8peptides
spectra
0.000 | 0.000
0.000 | 0.000
0.000 | 0.000
0.324 | 0.391
0.000 | 0.000
0.223 | 0.292
0.290 | 0.326
0.055 | 0.077
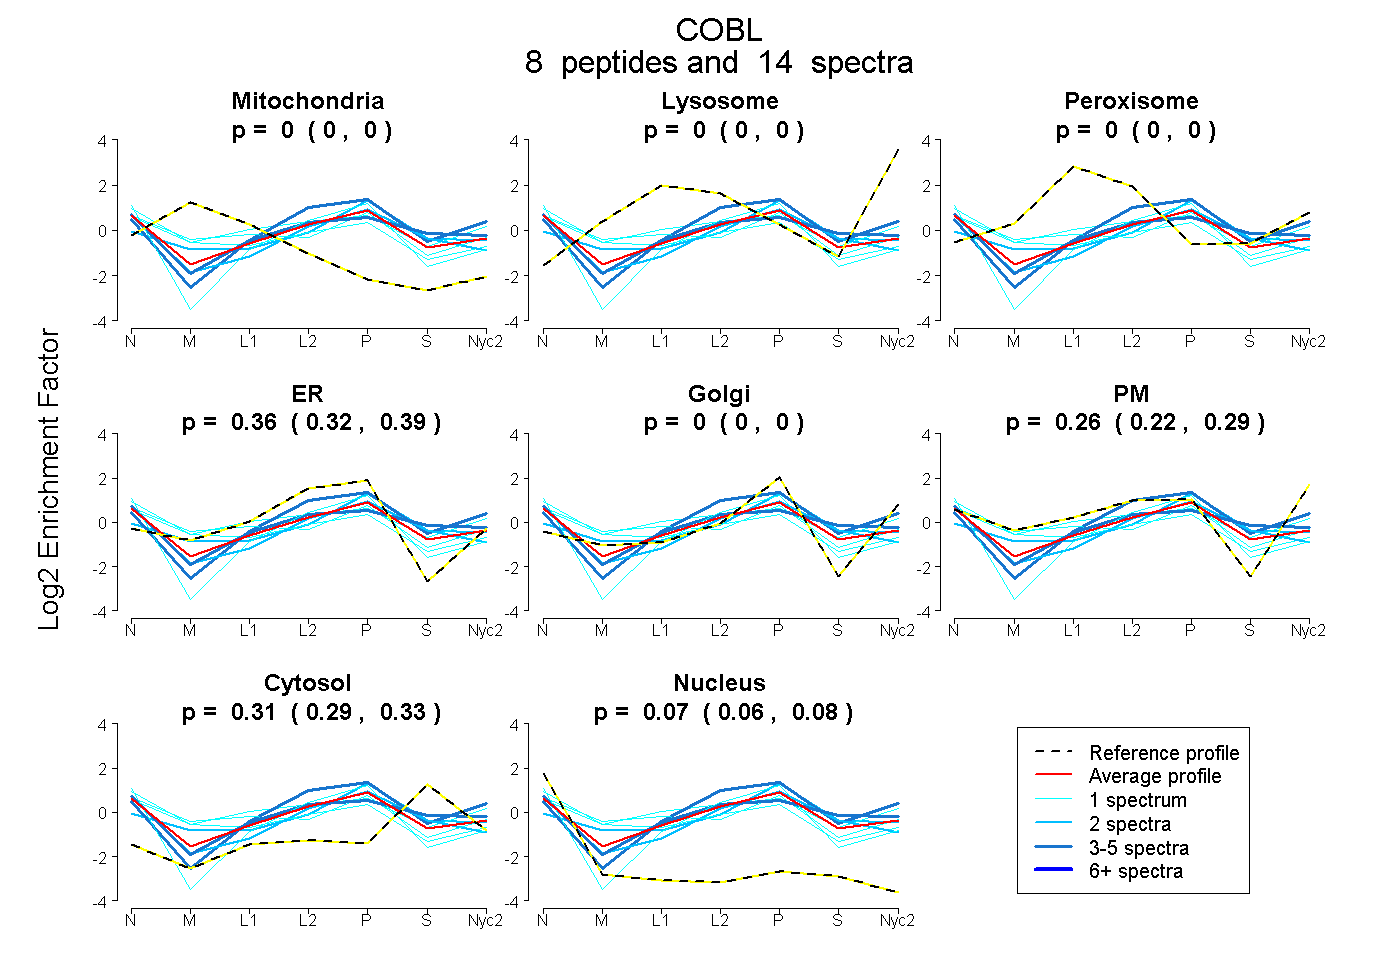
| Plot | Mito | Lyso | Perox | ER | Golgi | PM | Cytosol | Nucleus | |||||
| Expt A |
8 peptides |
14 spectra |
|
0.000 0.000 | 0.000 |
0.000 0.000 | 0.000 |
0.000 0.000 | 0.000 |
0.361 0.324 | 0.391 |
0.000 0.000 | 0.000 |
0.261 0.223 | 0.292 |
0.310 0.290 | 0.326 |
0.067 0.055 | 0.077 |
| 1 spectrum, LPSNPGGQLPADHPK | 0.035 | 0.000 | 0.257 | 0.000 | 0.429 | 0.069 | 0.058 | 0.153 | ||
| 1 spectrum, ASLSSQADLQK | 0.000 | 0.000 | 0.154 | 0.136 | 0.000 | 0.431 | 0.234 | 0.046 | ||
| 2 spectra, AHPAPLLLTEAR | 0.000 | 0.000 | 0.017 | 0.322 | 0.306 | 0.000 | 0.355 | 0.000 | ||
| 1 spectrum, TAEQGHEEAK | 0.000 | 0.000 | 0.000 | 0.581 | 0.047 | 0.000 | 0.167 | 0.205 | ||
| 3 spectra, FLGFFK | 0.000 | 0.000 | 0.000 | 0.386 | 0.000 | 0.279 | 0.335 | 0.000 | ||
| 1 spectrum, DNIAGEELELSK | 0.068 | 0.000 | 0.052 | 0.222 | 0.000 | 0.338 | 0.134 | 0.185 | ||
| 2 spectra, KPSYVEAESER | 0.000 | 0.000 | 0.000 | 0.477 | 0.030 | 0.023 | 0.371 | 0.099 | ||
| 3 spectra, SALLAAIR | 0.000 | 0.000 | 0.003 | 0.232 | 0.000 | 0.311 | 0.430 | 0.025 |
| Plot | Mito | Lyso or Perox | ER | Golgi | PM | Cytosol | Nucleus | ||||||
| Expt B |
3 peptides |
3 spectra |
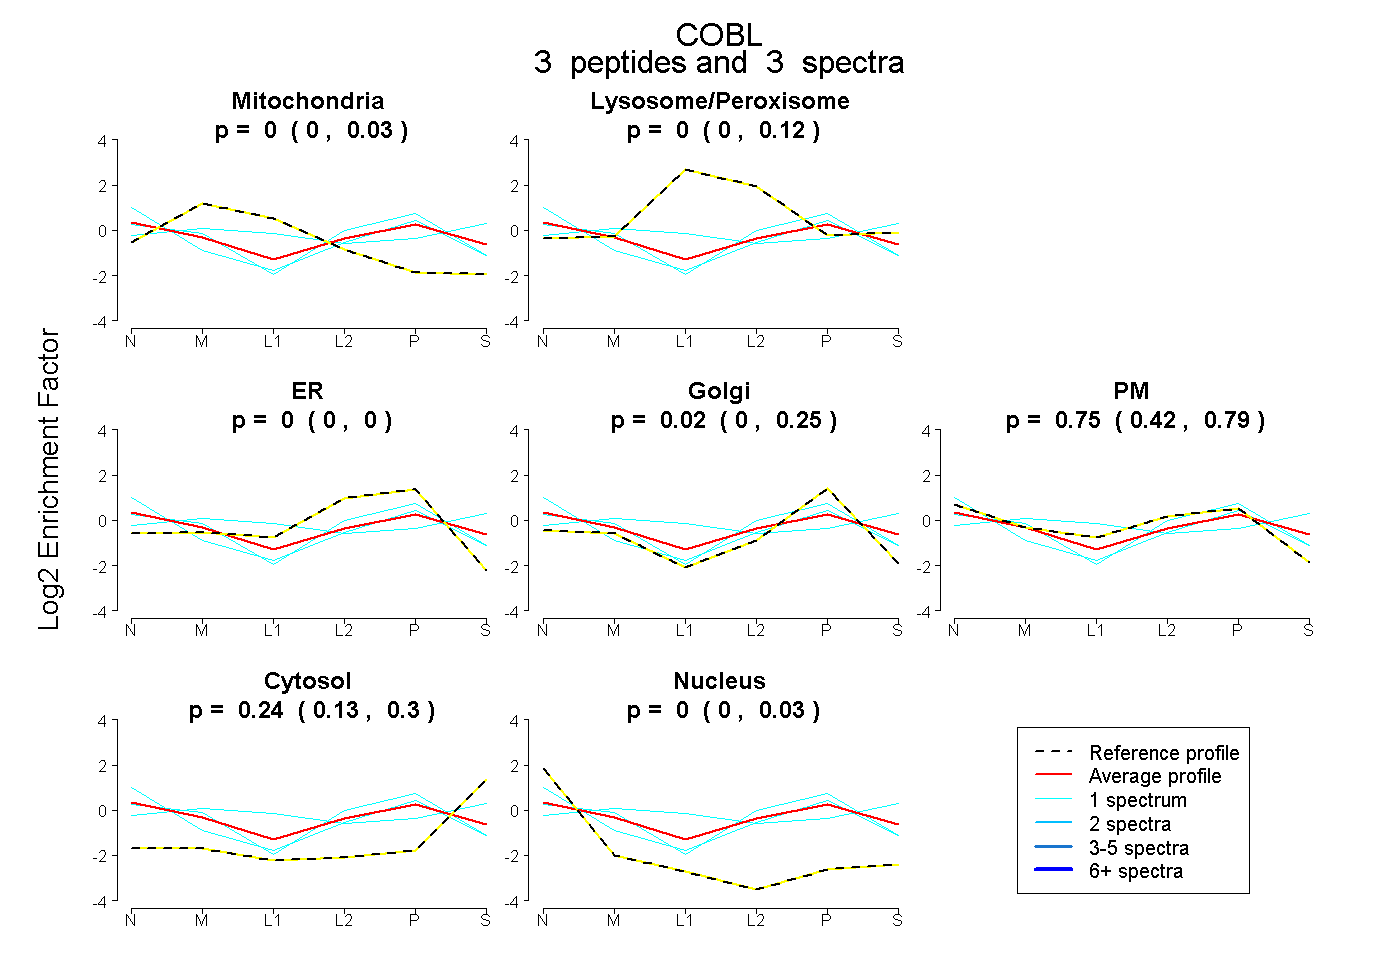 |
0.000 0.000 | 0.033 |
0.000 0.000 | 0.118 |
0.000 0.000 | 0.000 |
0.016 0.000 | 0.251 |
0.746 0.423 | 0.787 |
0.238 0.127 | 0.298 |
0.000 0.000 | 0.028 |
|||
| Plot | Lyso | Other | |||||||||||
| Expt C |
6 peptides |
14 spectra |
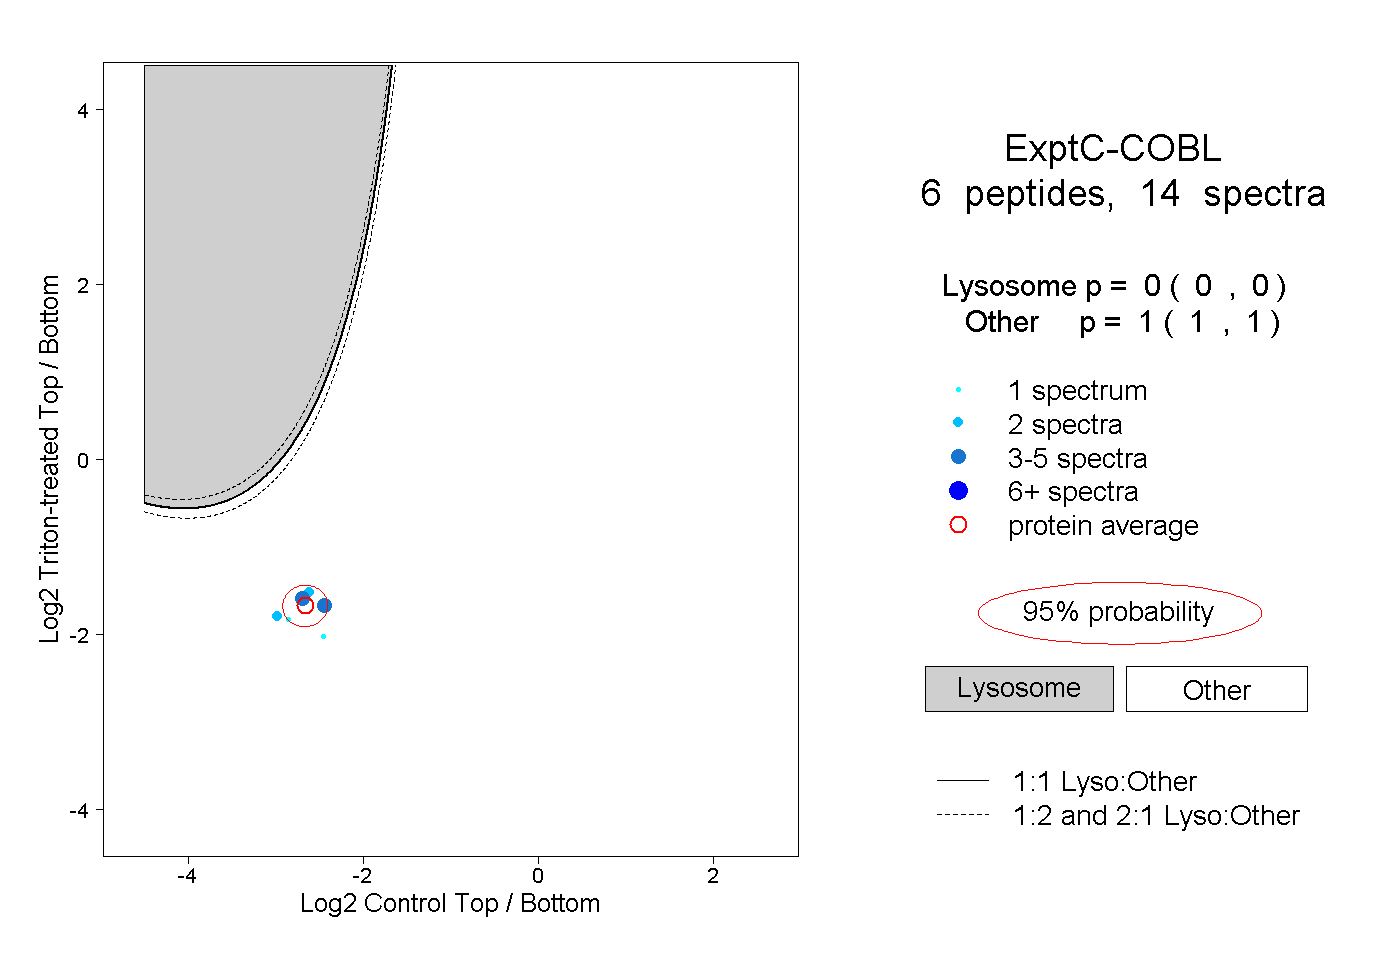 |
0.000 0.000 | 0.000 |
1.000 1.000 | 1.000 |
||||||||
| Plot | Lyso | Other | |||||||||||
| Expt D |
1 peptide |
1 spectrum |
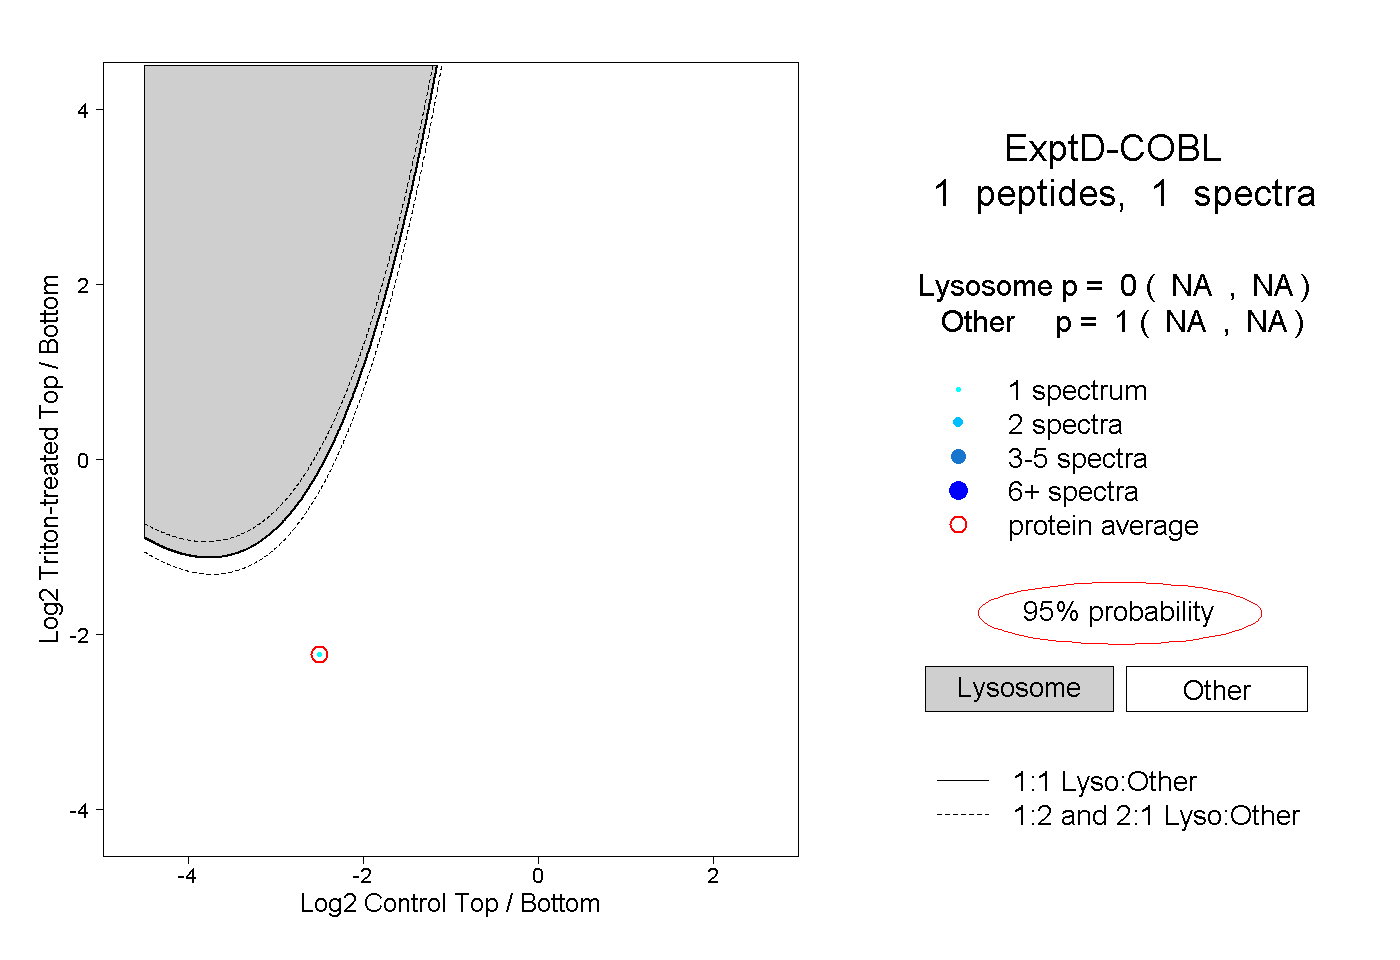 |
0.000 NA | NA |
1.000 NA | NA |