 20
20peptides
spectra
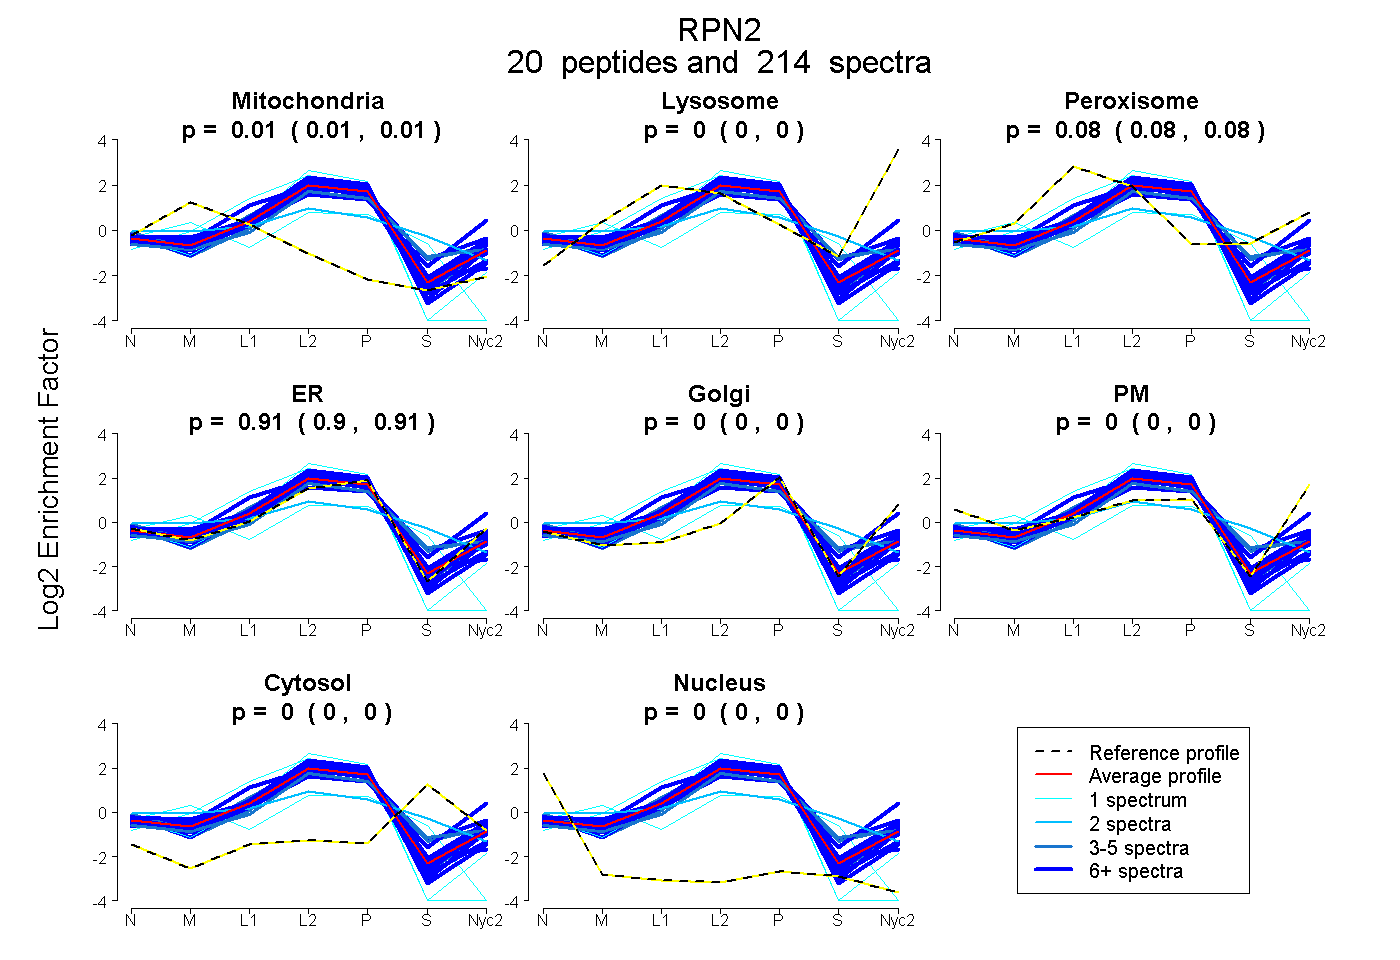
0.009 | 0.012
0.000 | 0.000
0.079 | 0.085
0.905 | 0.909
0.000 | 0.000
0.000 | 0.000
0.000 | 0.000
0.000 | 0.000
14peptides
spectra
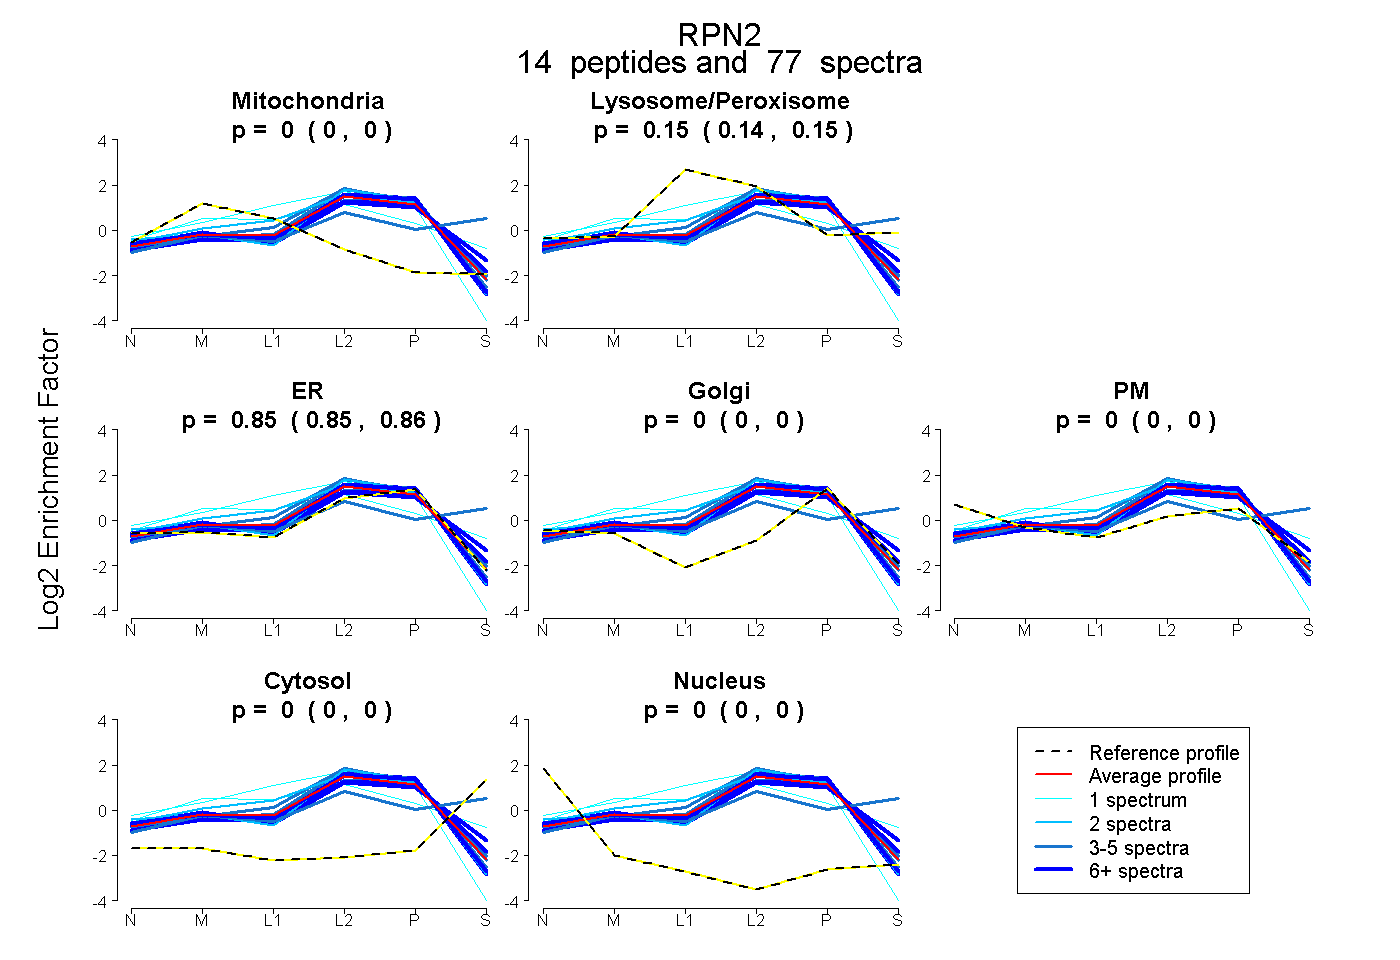
0.000 | 0.000
0.138 | 0.152
0.847 | 0.861
0.000 | 0.000
0.000 | 0.000
0.000 | 0.000
0.000 | 0.000
17peptides
spectra
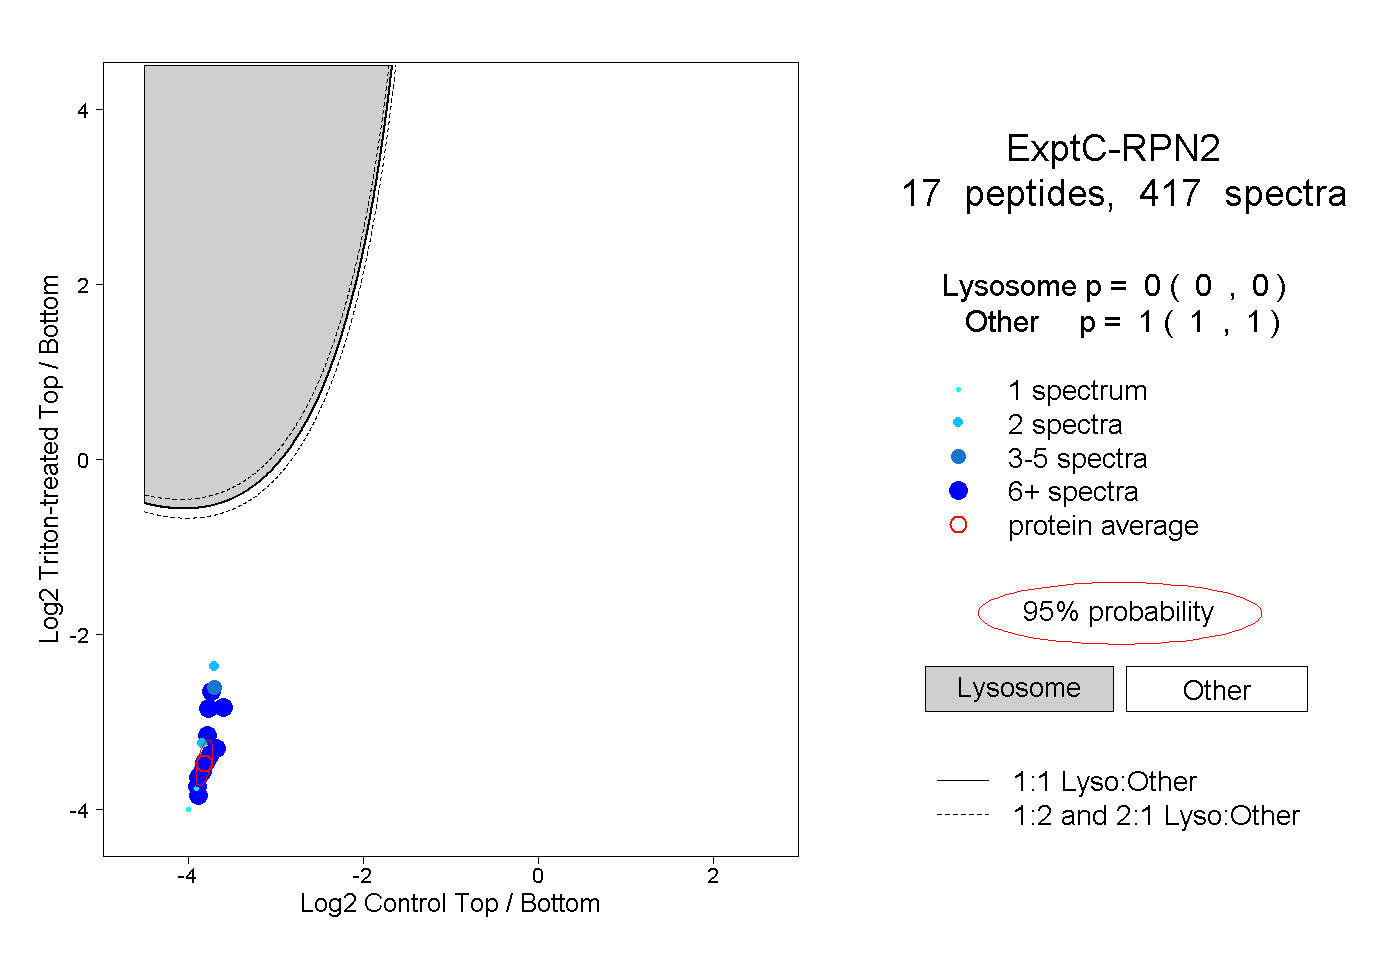
0.000 | 0.000
1.000 | 1.000
10peptides
spectra
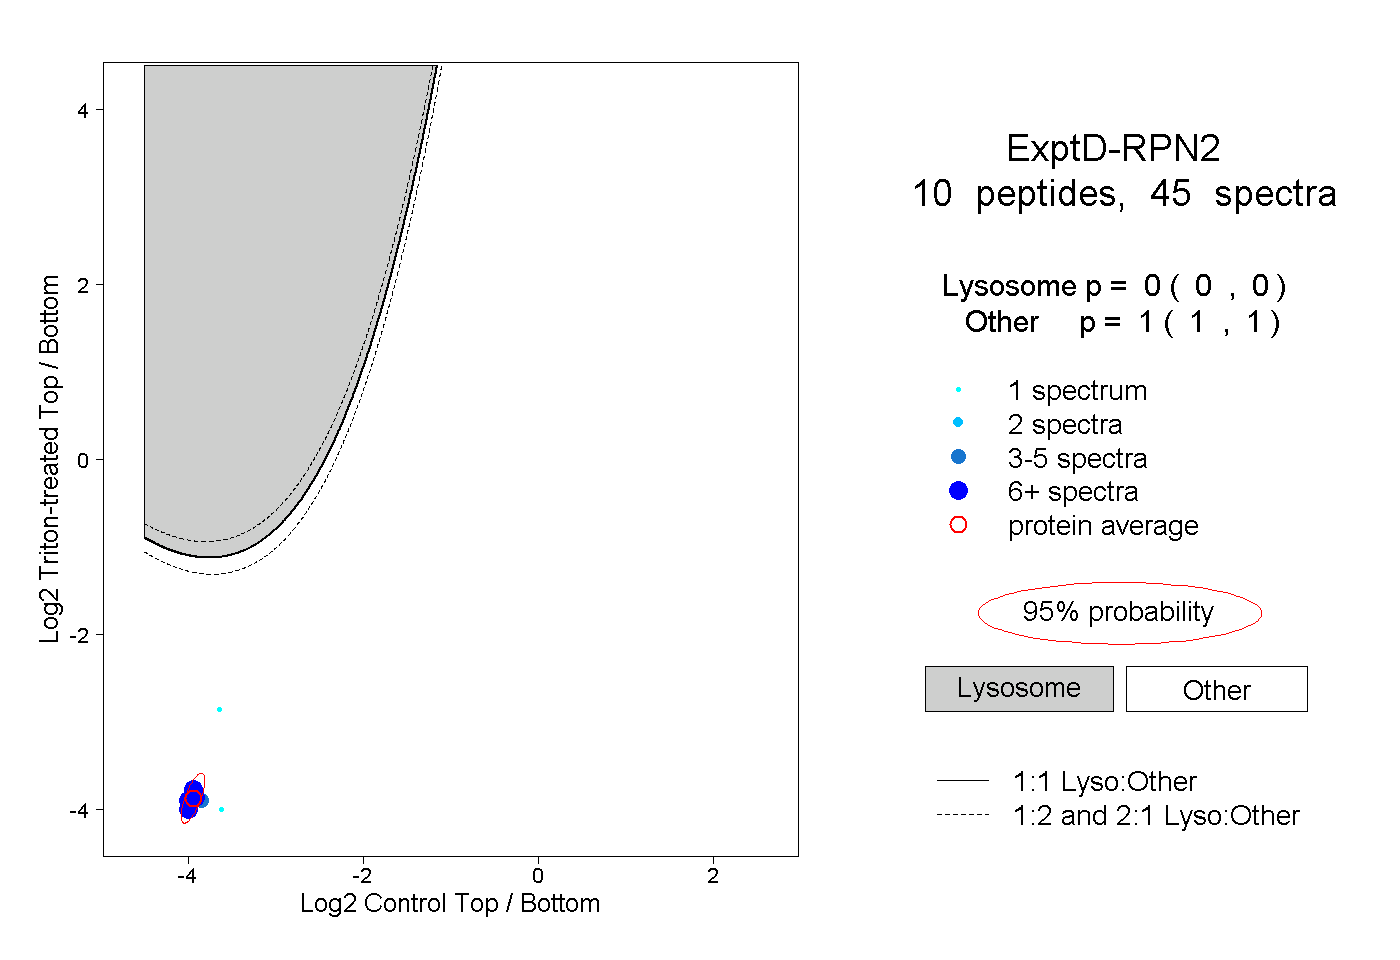
0.000 | 0.000
1.000 | 1.000