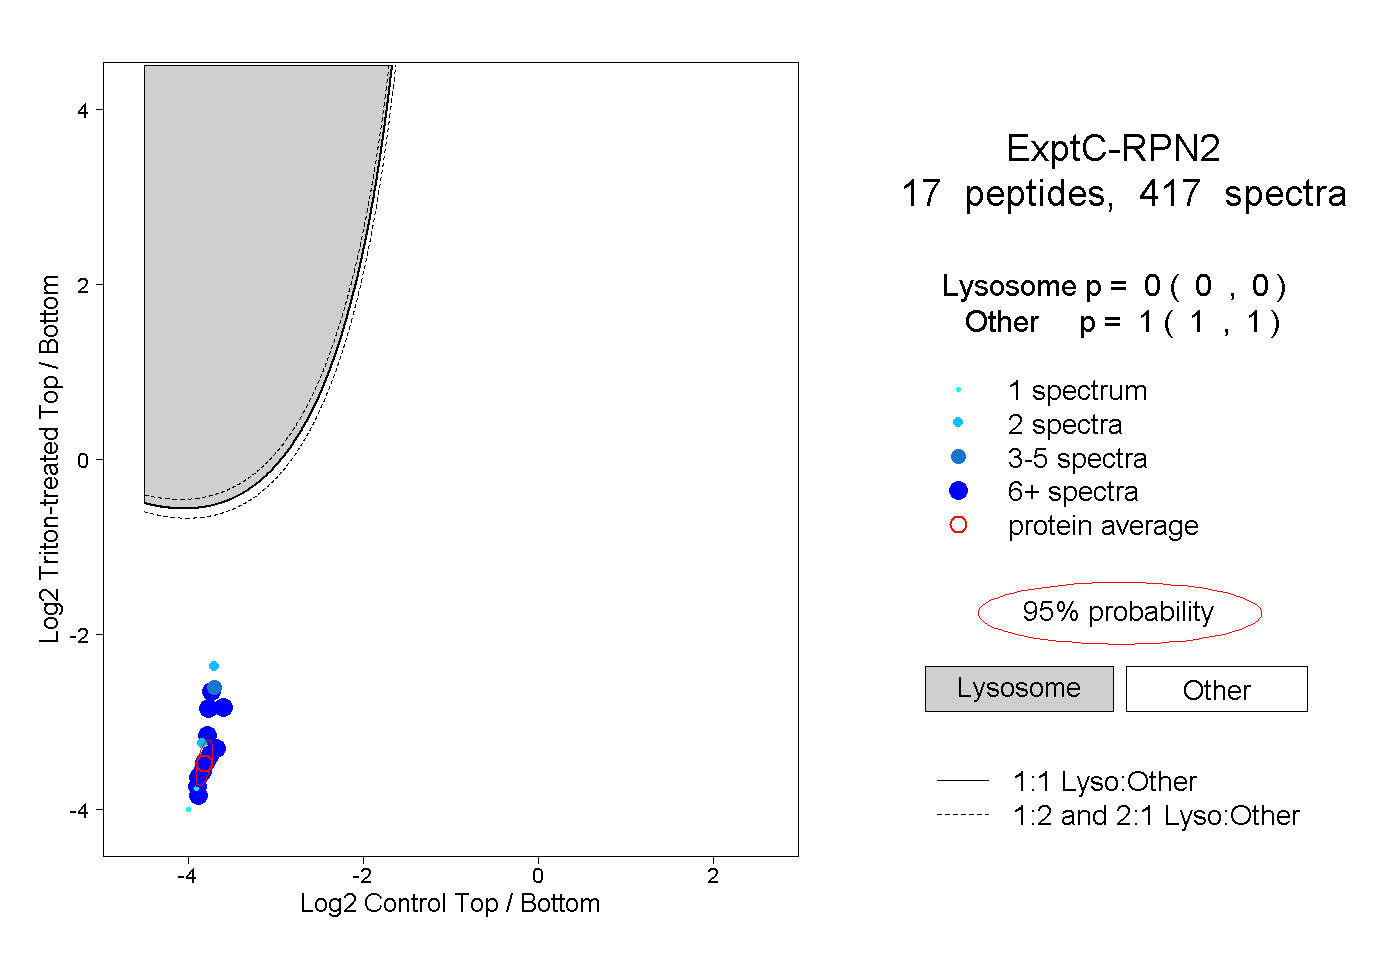
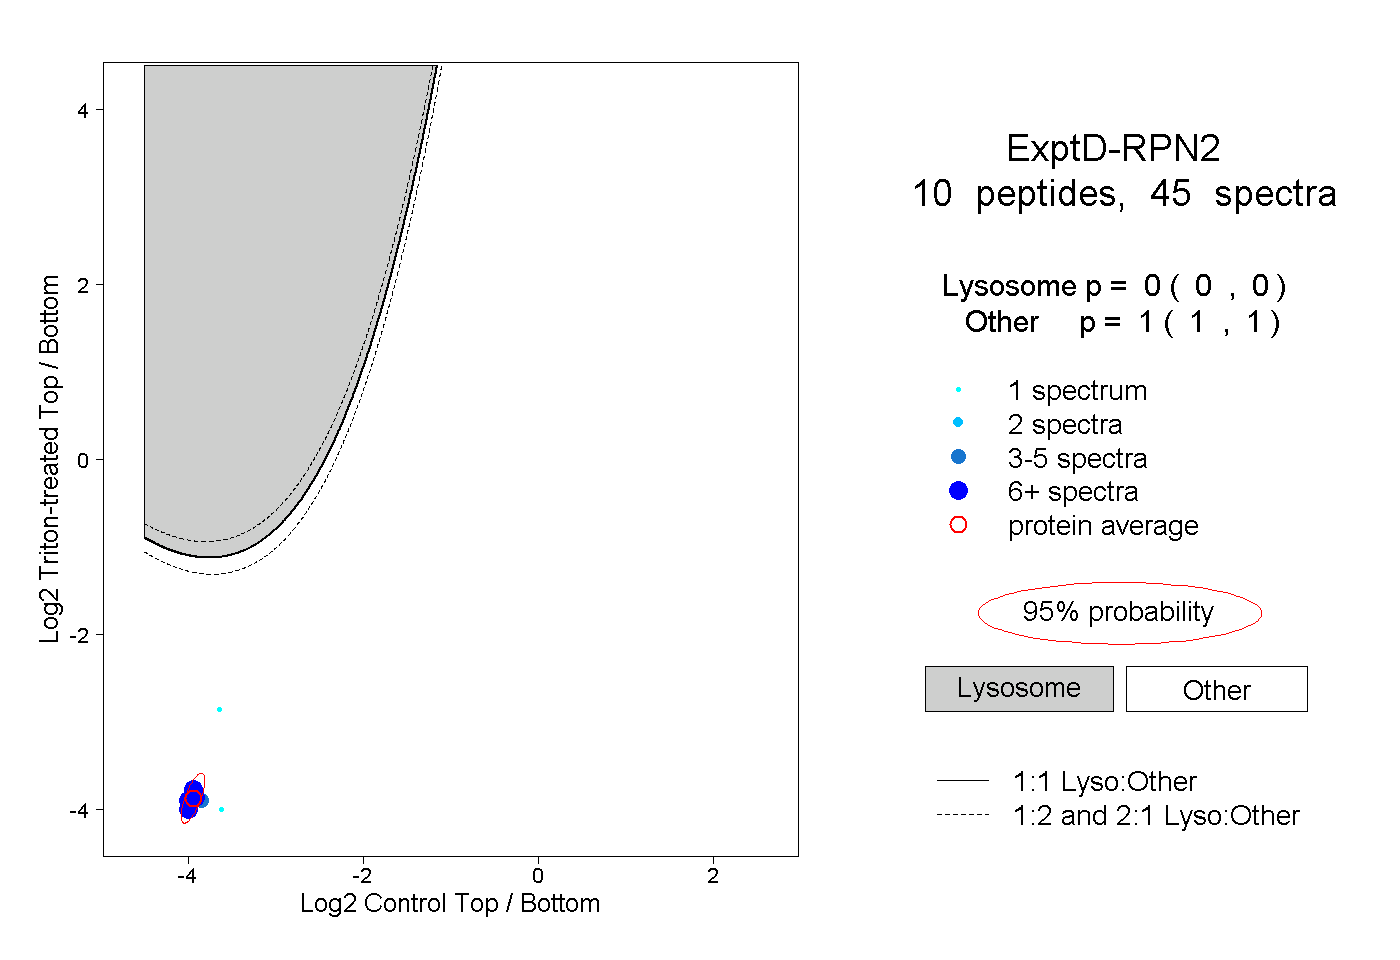
| 13 spectra, FELDTSER |
0.000 |
|
0.044 |
|
0.956 |
0.000 |
0.000 |
0.000 |
0.000 |
|
| 1 spectrum, EETVLATVQALHTASHLSQQADLR |
0.150 |
|
0.447 |
|
0.259 |
0.143 |
0.000 |
0.000 |
0.000 |
|
| 4 spectra, NPILWNVADVVIK |
0.000 |
|
0.239 |
|
0.761 |
0.000 |
0.000 |
0.000 |
0.000 |
|
| 13 spectra, QEIQHLFR |
0.000 |
|
0.124 |
|
0.864 |
0.000 |
0.000 |
0.012 |
0.000 |
|
| 1 spectrum, ACAFIK |
0.097 |
|
0.166 |
|
0.737 |
0.000 |
0.000 |
0.000 |
0.000 |
|
| 5 spectra, NIVEEIEDLVAR |
0.000 |
|
0.080 |
|
0.920 |
0.000 |
0.000 |
0.000 |
0.000 |
|
| 3 spectra, LPSGYYDFSVR |
0.004 |
|
0.102 |
|
0.894 |
0.000 |
0.000 |
0.000 |
0.000 |
|
| 2 spectra, VTYPAK |
0.007 |
|
0.203 |
|
0.790 |
0.000 |
0.000 |
0.000 |
0.000 |
|
| 2 spectra, TGQEVVFVAEPDNK |
0.000 |
|
0.000 |
|
1.000 |
0.000 |
0.000 |
0.000 |
0.000 |
|
| 3 spectra, YHVPVVVVPEGSASDTQEQAILR |
0.000 |
|
0.361 |
|
0.291 |
0.000 |
0.000 |
0.348 |
0.000 |
|
| 8 spectra, MPFSLVGDVFELNFK |
0.000 |
|
0.006 |
|
0.994 |
0.000 |
0.000 |
0.000 |
0.000 |
|
| 6 spectra, LQVSSVLSQPLAQAAVK |
0.000 |
|
0.153 |
|
0.788 |
0.000 |
0.000 |
0.059 |
0.000 |
|
| 4 spectra, MLAQQAVK |
0.000 |
|
0.146 |
|
0.854 |
0.000 |
0.000 |
0.000 |
0.000 |
|
| 12 spectra, YIANTVELR |
0.000 |
|
0.051 |
|
0.949 |
0.000 |
0.000 |
0.000 |
0.000 |
|
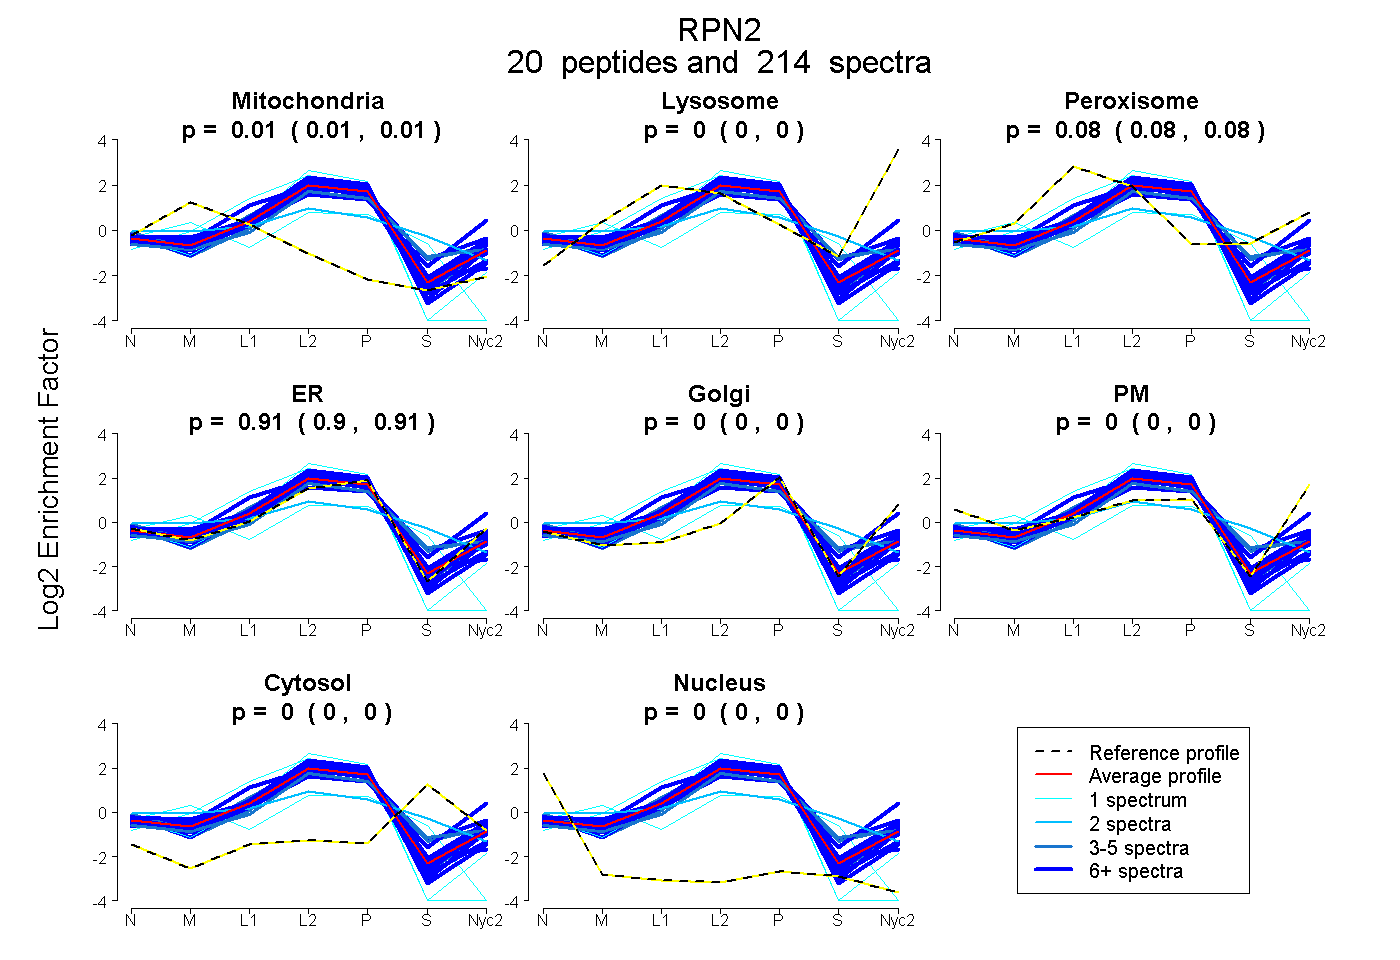
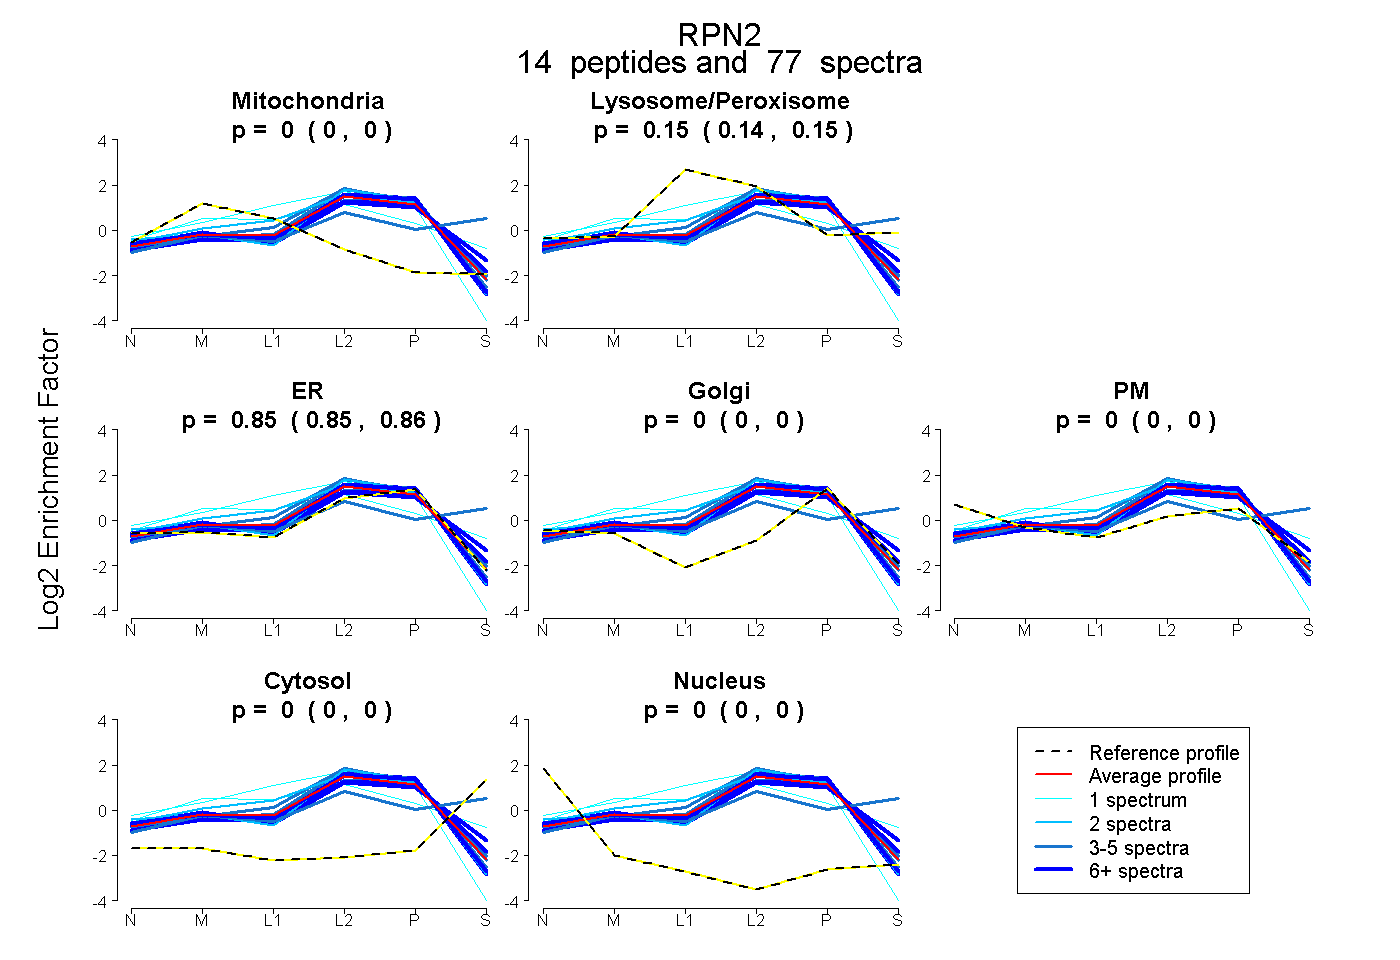
 20
20