 10
10peptides
spectra
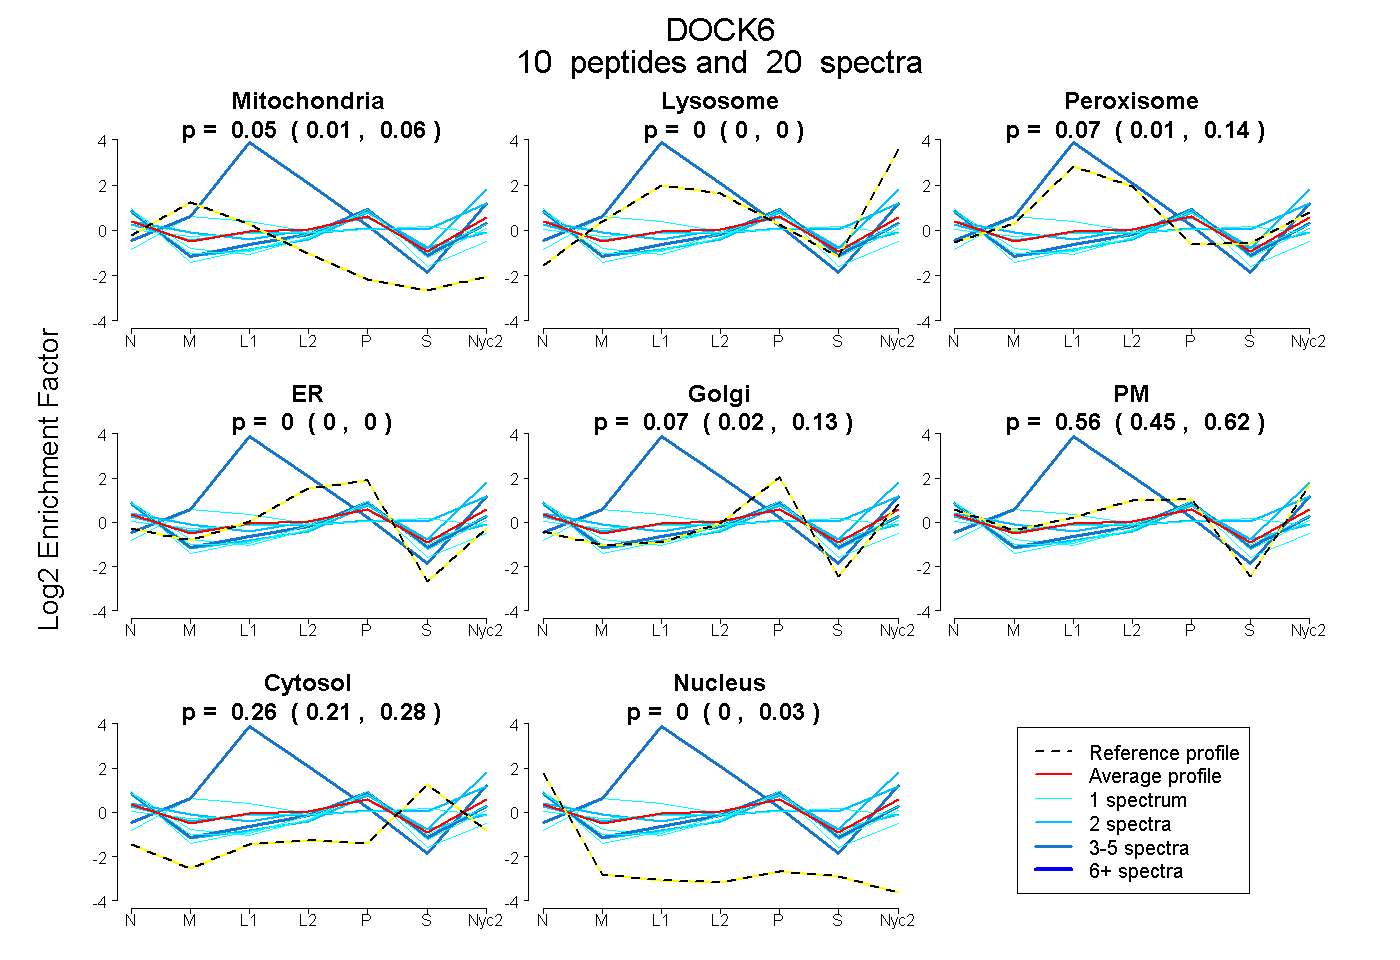
0.005 | 0.062
0.000 | 0.000
0.013 | 0.136
0.000 | 0.000
0.020 | 0.128
0.453 | 0.624
0.213 | 0.279
0.000 | 0.026
4peptides
spectra
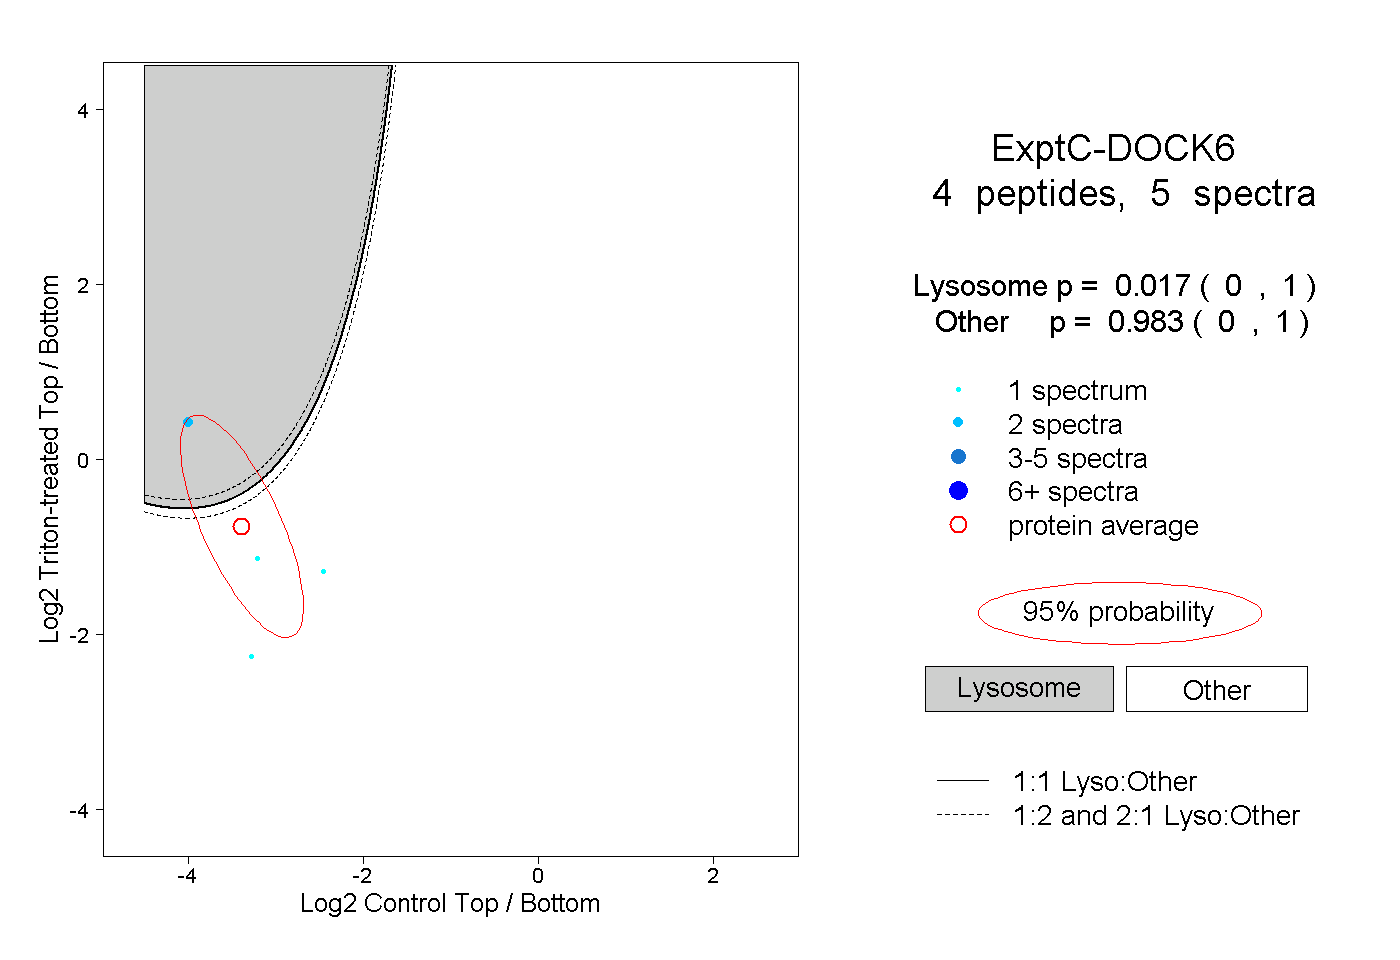
0.000 | 1.000
0.000 | 1.000
1peptide
spectrum
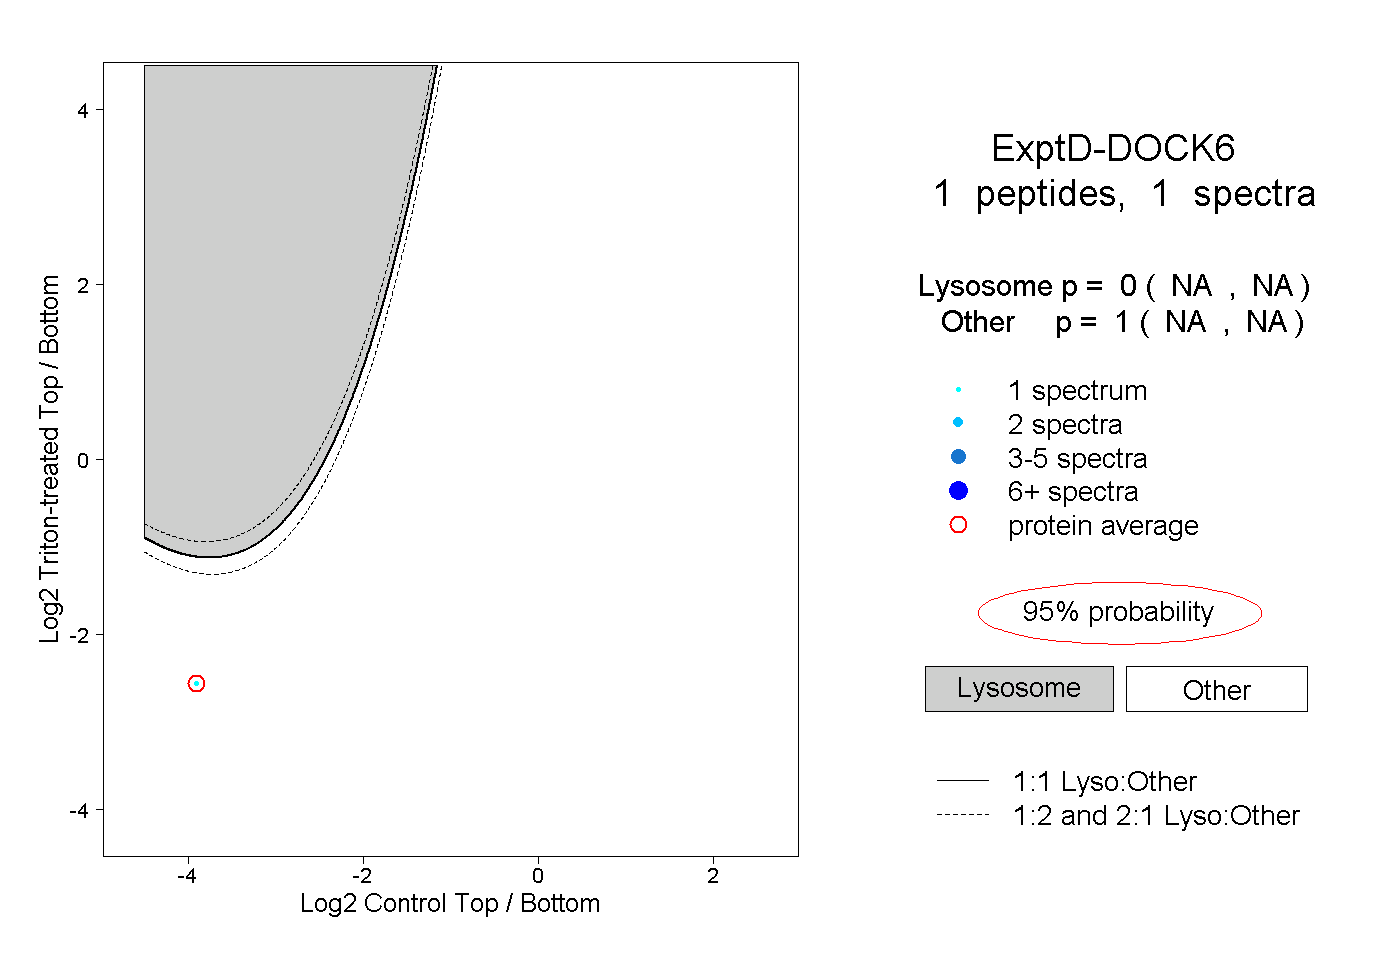
NA | NA
NA | NA