 10
10peptides
spectra
0.005 | 0.062
0.000 | 0.000
0.013 | 0.136
0.000 | 0.000
0.020 | 0.128
0.453 | 0.624
0.213 | 0.279
0.000 | 0.026
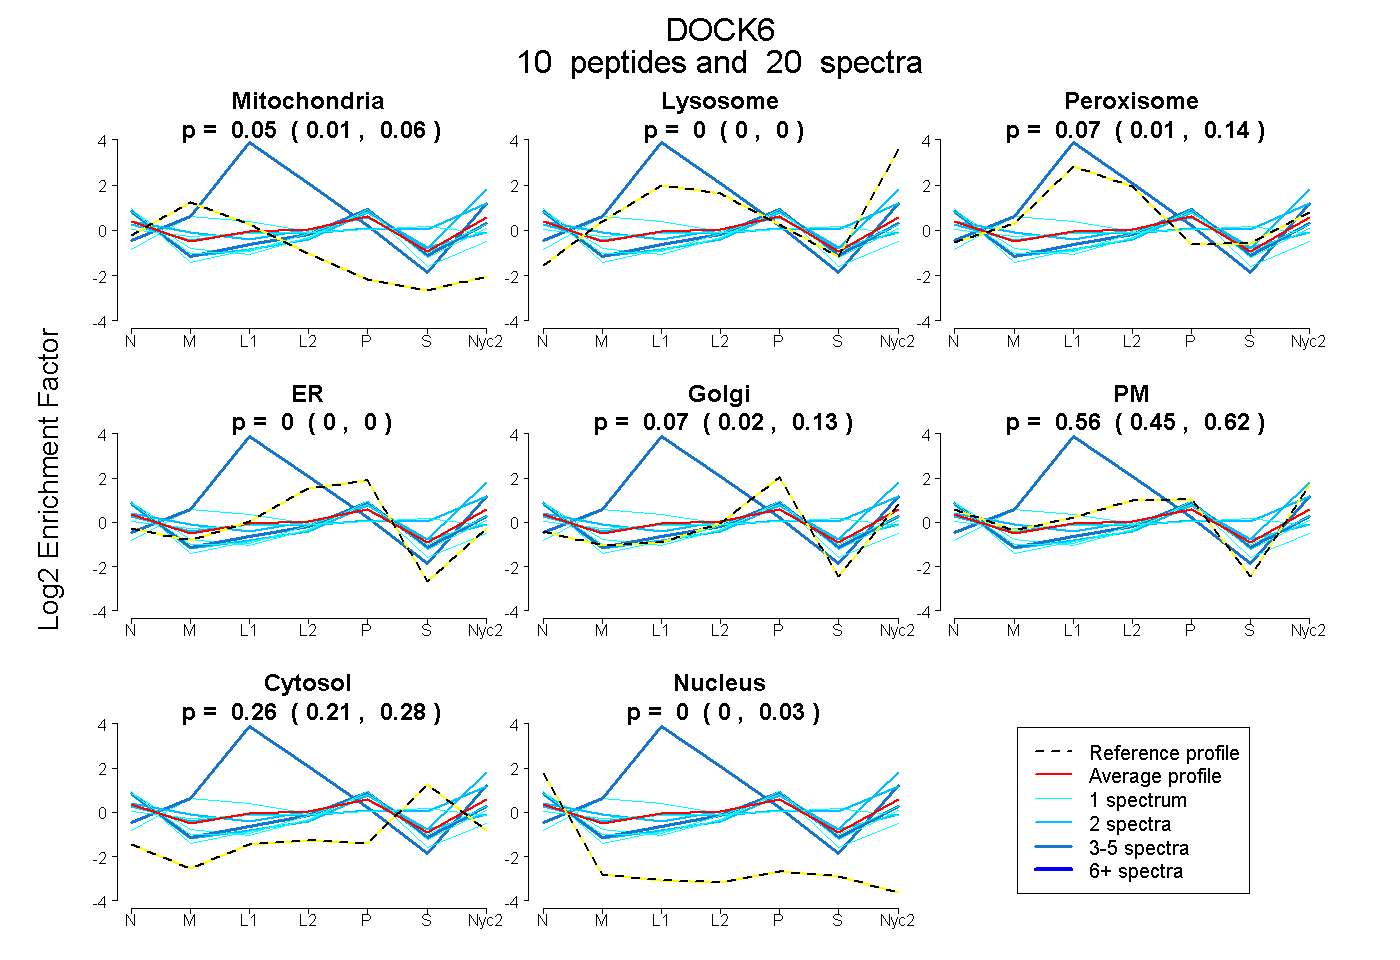
| Plot | Mito | Lyso | Perox | ER | Golgi | PM | Cytosol | Nucleus | |||||
| Expt A |
10 peptides |
20 spectra |
|
0.047 0.005 | 0.062 |
0.000 0.000 | 0.000 |
0.067 0.013 | 0.136 |
0.000 0.000 | 0.000 |
0.073 0.020 | 0.128 |
0.557 0.453 | 0.624 |
0.257 0.213 | 0.279 |
0.000 0.000 | 0.026 |
| 2 spectra, LDTPR | 0.000 | 0.109 | 0.072 | 0.000 | 0.000 | 0.441 | 0.379 | 0.000 | ||
| 5 spectra, LAAVHGK | 0.000 | 0.140 | 0.832 | 0.028 | 0.000 | 0.000 | 0.000 | 0.000 | ||
| 2 spectra, GYIFSLVR | 0.000 | 0.000 | 0.000 | 0.023 | 0.192 | 0.395 | 0.278 | 0.112 | ||
| 4 spectra, RPSSLLR | 0.000 | 0.000 | 0.000 | 0.006 | 0.187 | 0.504 | 0.208 | 0.095 | ||
| 1 spectrum, LVVRPPVICGQMVNLGR | 0.002 | 0.000 | 0.000 | 0.188 | 0.244 | 0.270 | 0.092 | 0.204 | ||
| 1 spectrum, TILTYAEEDLGLR | 0.000 | 0.000 | 0.000 | 0.000 | 0.191 | 0.481 | 0.228 | 0.100 | ||
| 1 spectrum, SSGASGVFSLR | 0.090 | 0.000 | 0.212 | 0.000 | 0.076 | 0.226 | 0.396 | 0.000 | ||
| 2 spectra, NAEPALLQR | 0.000 | 0.107 | 0.000 | 0.000 | 0.000 | 0.658 | 0.235 | 0.000 | ||
| 1 spectrum, EAFTPVVYHNK | 0.107 | 0.477 | 0.000 | 0.000 | 0.312 | 0.000 | 0.104 | 0.000 | ||
| 1 spectrum, TSISQGPSTAAR | 0.000 | 0.000 | 0.000 | 0.000 | 0.279 | 0.400 | 0.183 | 0.139 |
| Plot | Lyso | Other | |||||||||||
| Expt C |
4 peptides |
5 spectra |
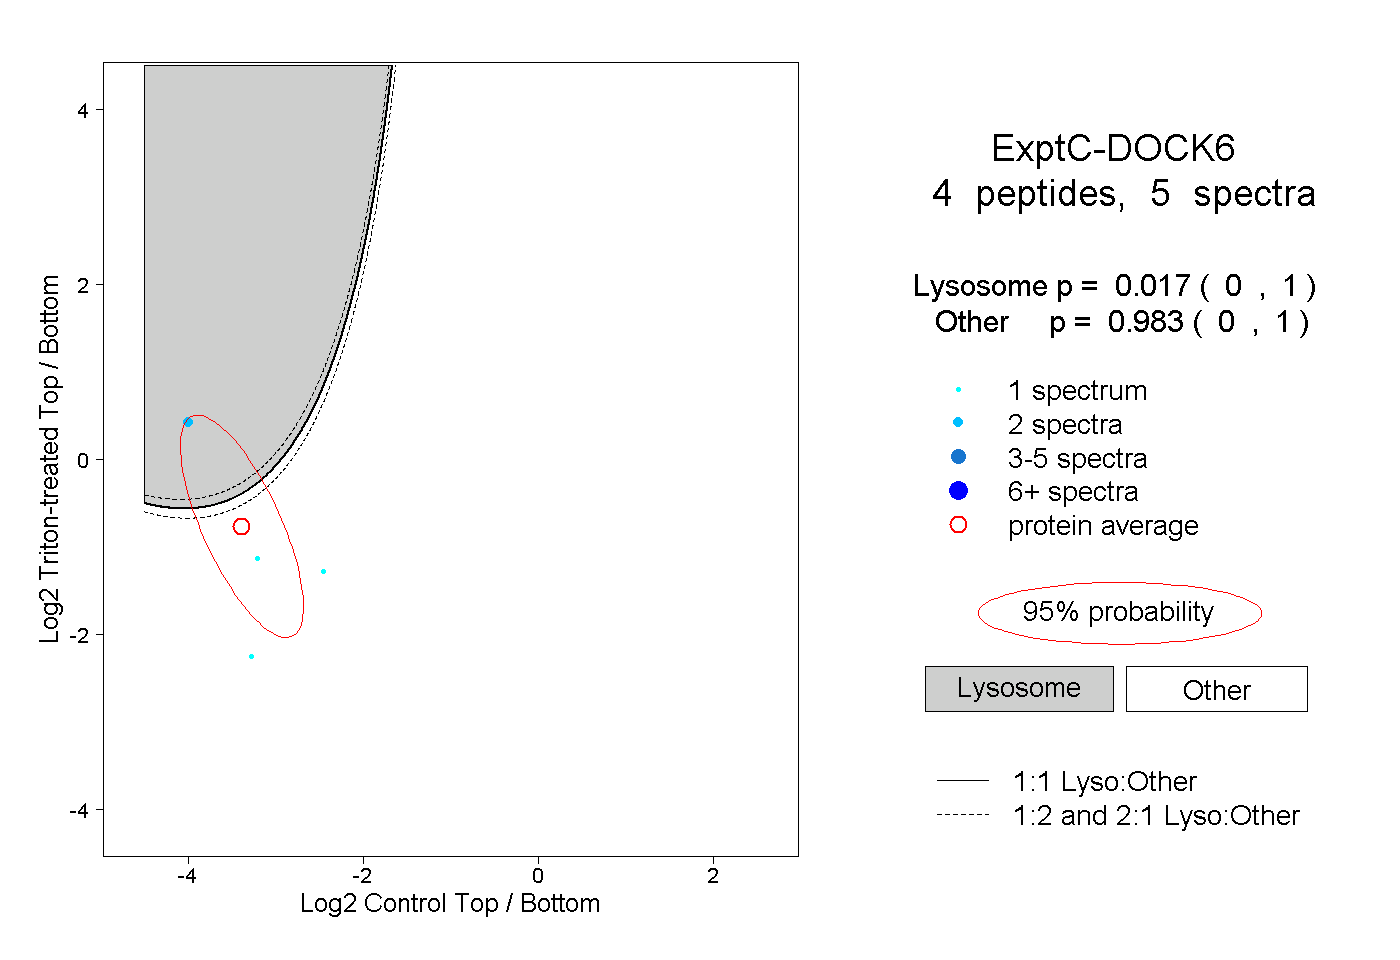 |
0.017 0.000 | 1.000 |
0.983 0.000 | 1.000 |
||||||||
| Plot | Lyso | Other | |||||||||||
| Expt D |
1 peptide |
1 spectrum |
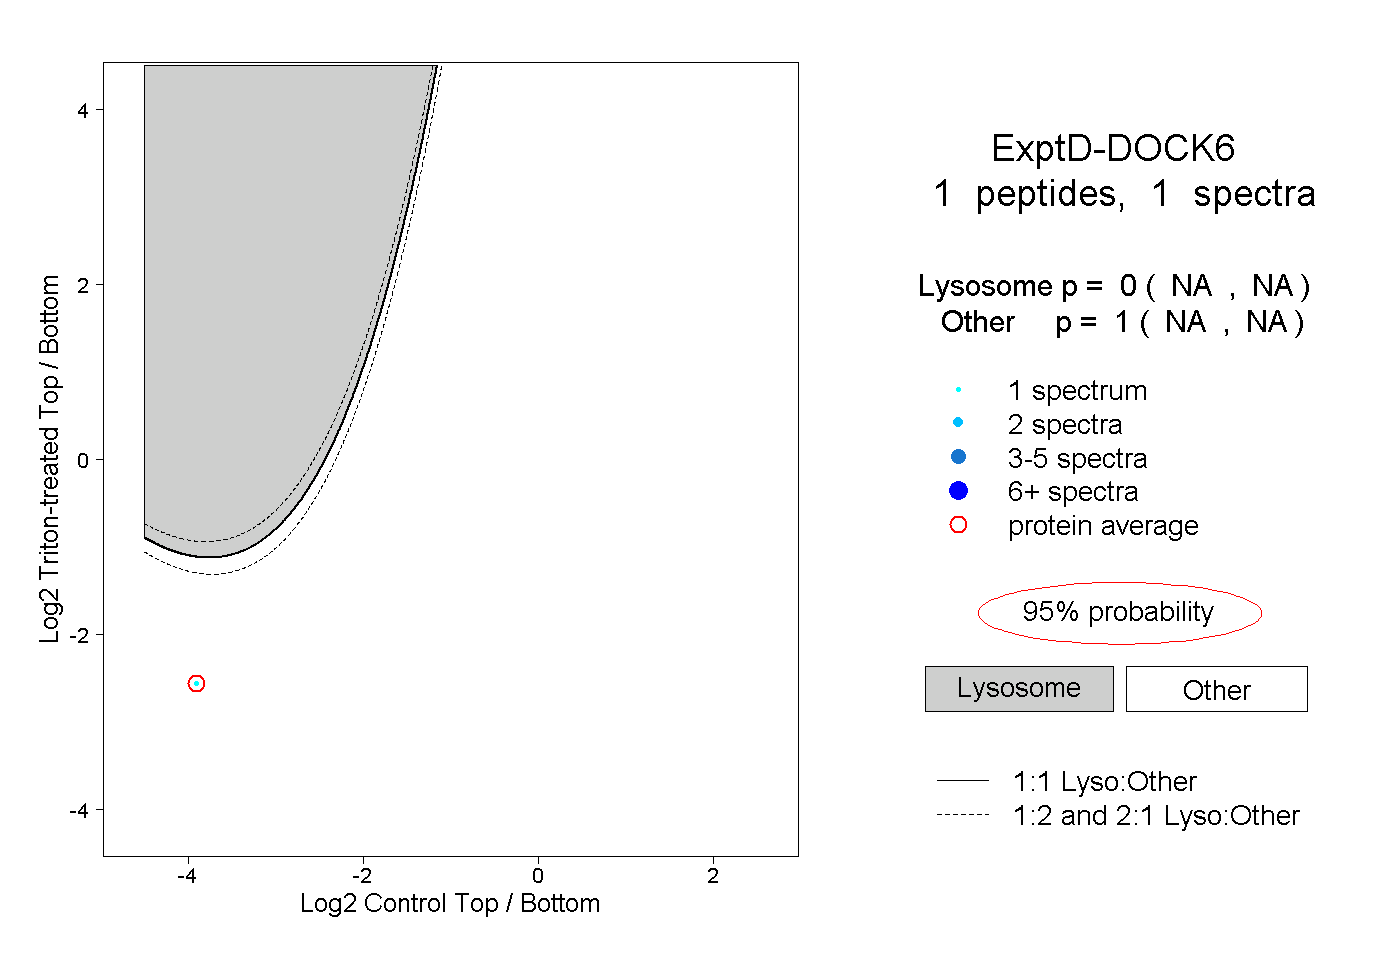 |
0.000 NA | NA |
1.000 NA | NA |