 9
9peptides
spectra
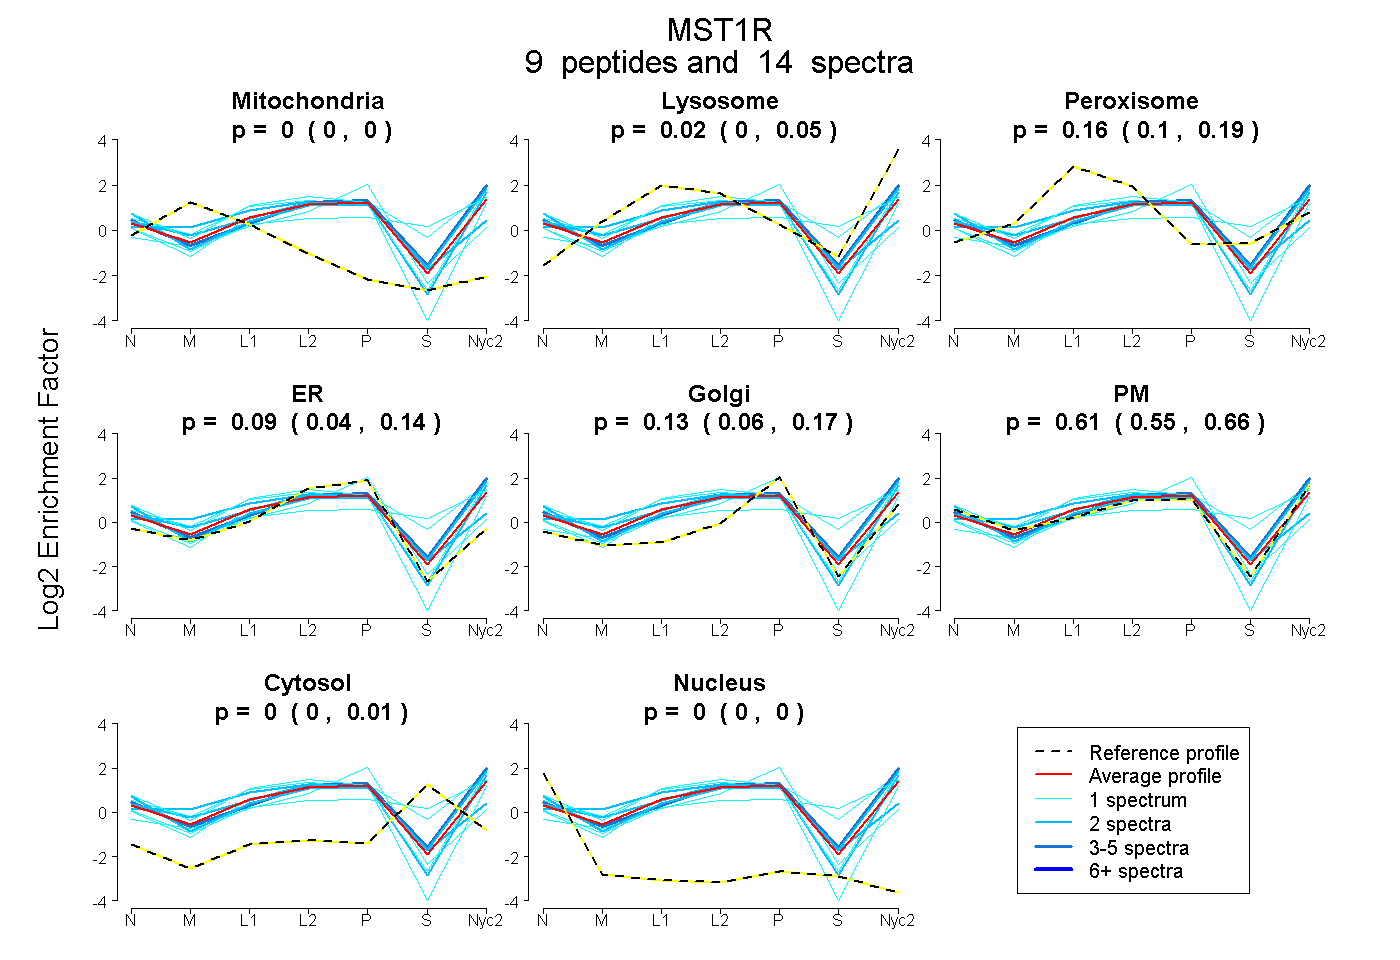
0.000 | 0.000
0.000 | 0.048
0.100 | 0.190
0.044 | 0.138
0.056 | 0.165
0.553 | 0.663
0.000 | 0.012
0.000 | 0.000
4peptides
spectra
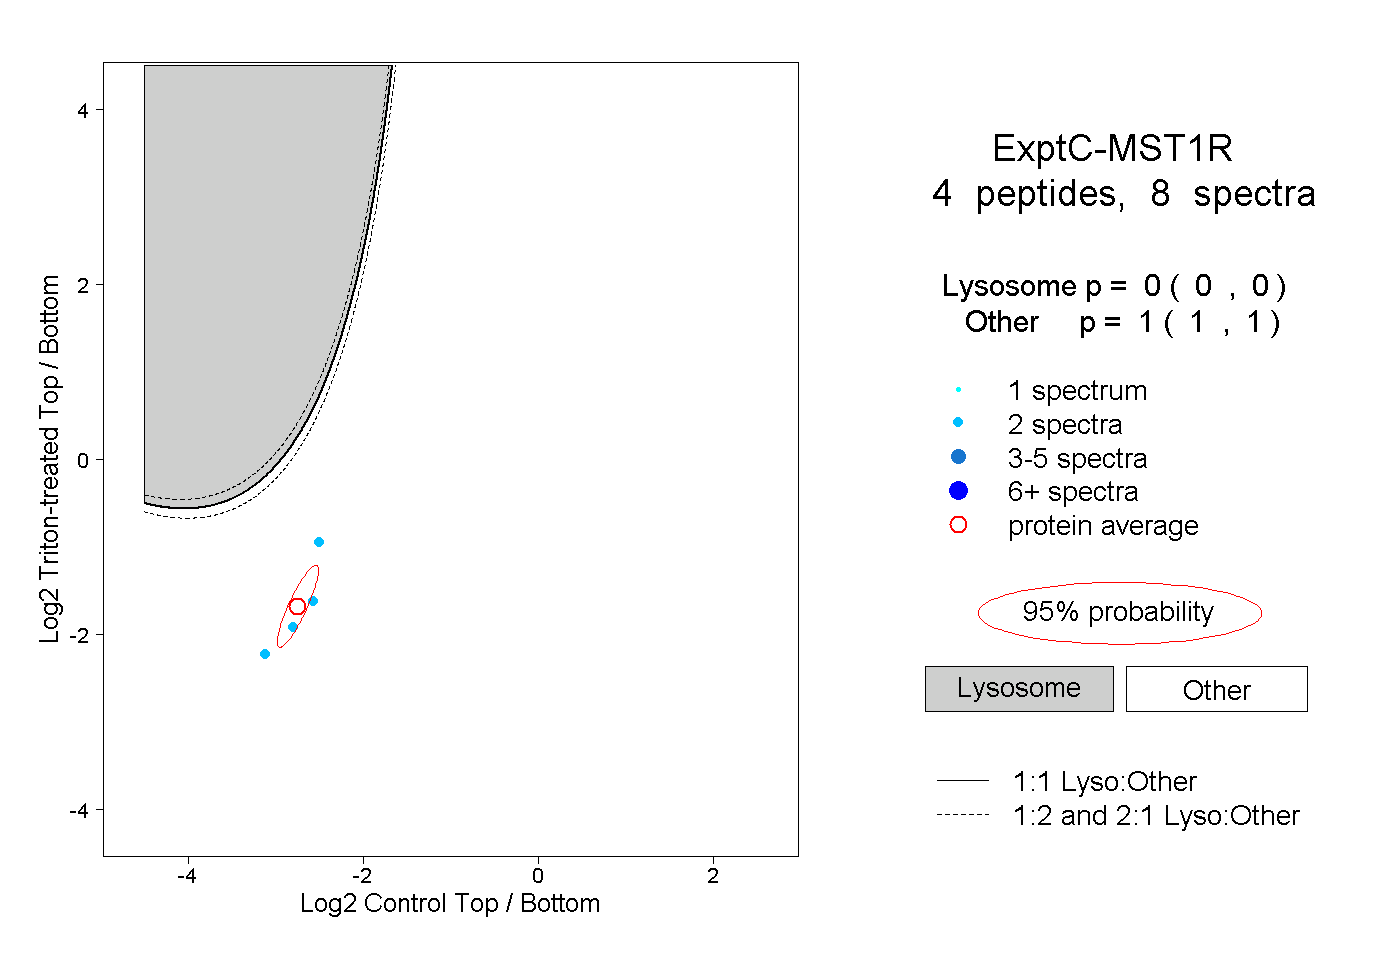
0.000 | 0.000
1.000 | 1.000
2peptides
spectra
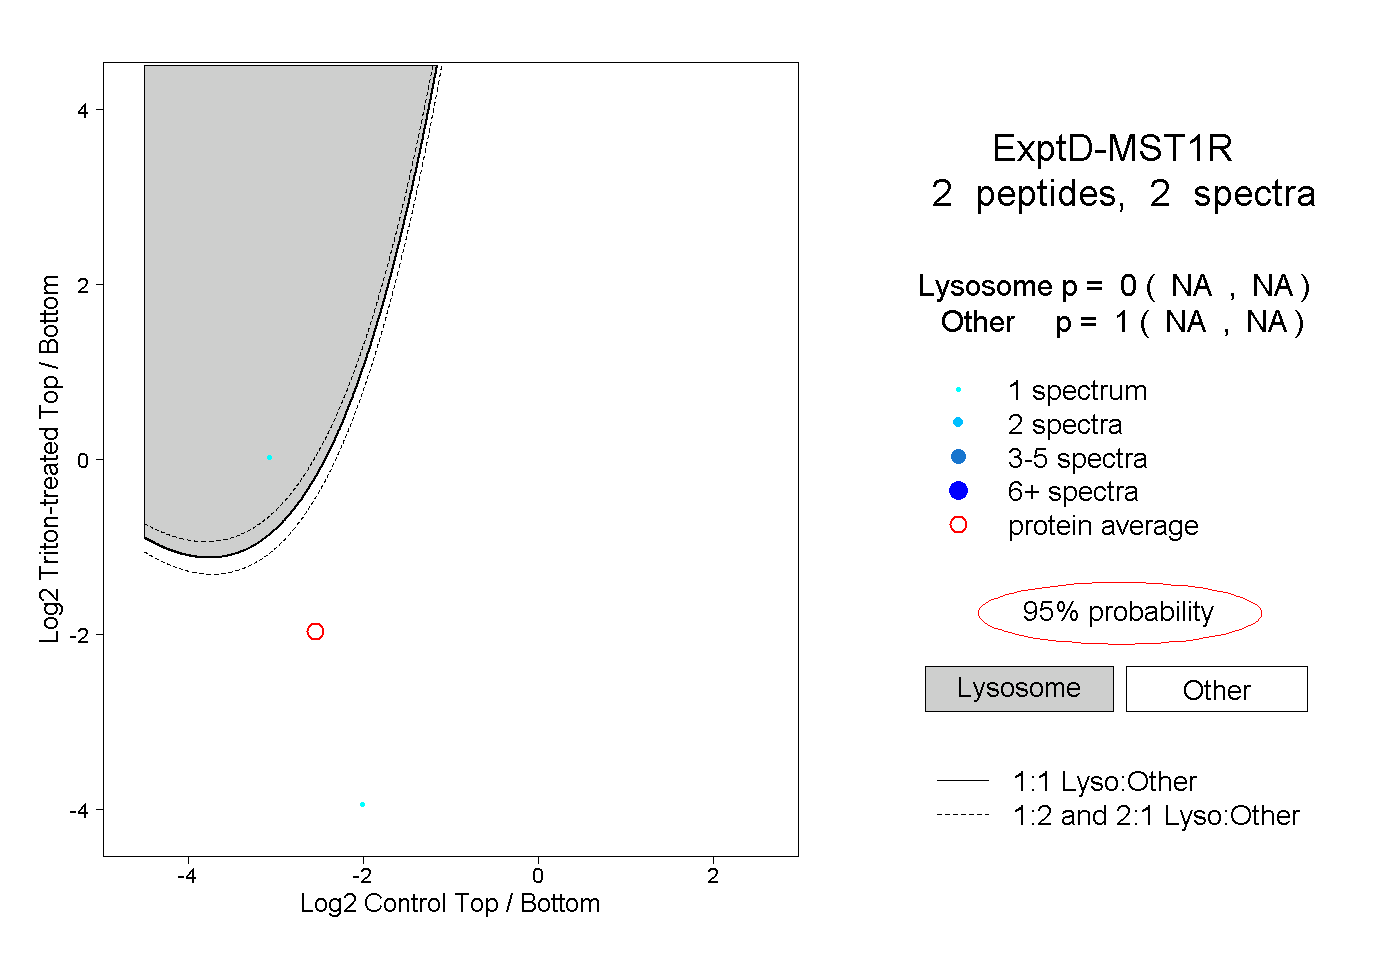
NA | NA
NA | NA