 9
9peptides
spectra
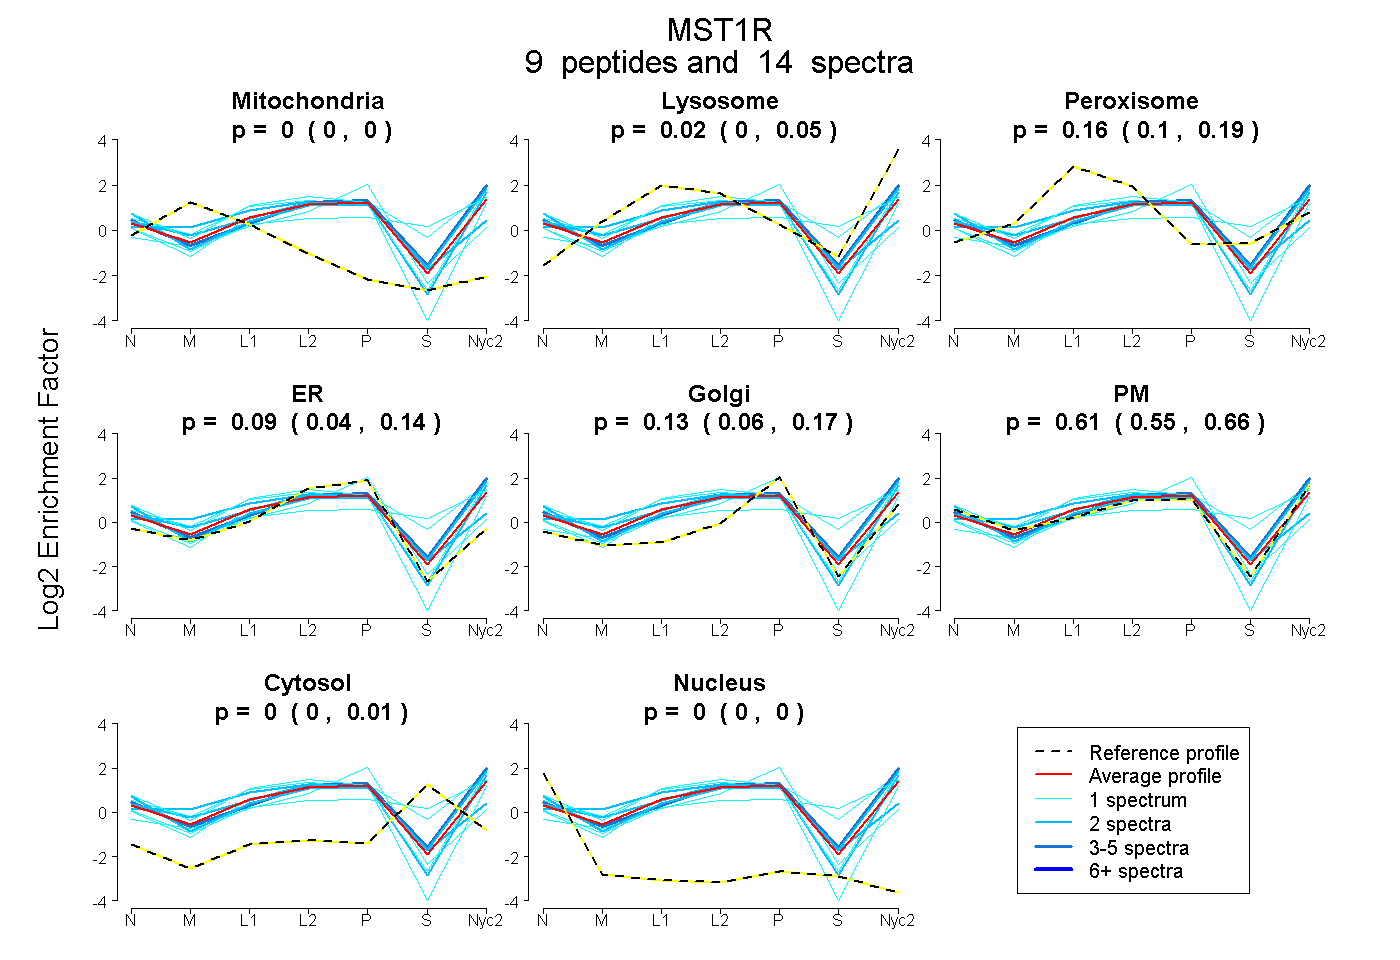
0.000 | 0.000
0.000 | 0.048
0.100 | 0.190
0.044 | 0.138
0.056 | 0.165
0.553 | 0.663
0.000 | 0.012
0.000 | 0.000
| Plot | Mito | Lyso | Perox | ER | Golgi | PM | Cytosol | Nucleus | |||||
| Expt A |
9 peptides |
14 spectra |
|
0.000 0.000 | 0.000 |
0.017 0.000 | 0.048 |
0.158 0.100 | 0.190 |
0.085 0.044 | 0.138 |
0.127 0.056 | 0.165 |
0.613 0.553 | 0.663 |
0.000 0.000 | 0.012 |
0.000 0.000 | 0.000 |
| 1 spectrum, YVVPSFSAGGR | 0.000 | 0.199 | 0.073 | 0.000 | 0.000 | 0.395 | 0.333 | 0.000 | ||
| 1 spectrum, VTALHVTR | 0.000 | 0.000 | 0.000 | 0.253 | 0.000 | 0.747 | 0.000 | 0.000 | ||
| 3 spectra, LQDLDK | 0.000 | 0.134 | 0.000 | 0.001 | 0.017 | 0.802 | 0.045 | 0.000 | ||
| 1 spectrum, LEQVSEEK | 0.000 | 0.000 | 0.082 | 0.553 | 0.364 | 0.000 | 0.000 | 0.000 | ||
| 1 spectrum, GAPPYPHIDPFDLSHFLVQGR | 0.000 | 0.273 | 0.032 | 0.071 | 0.000 | 0.426 | 0.198 | 0.000 | ||
| 2 spectra, VPIQGPGCGHFLTCWR | 0.001 | 0.000 | 0.204 | 0.398 | 0.000 | 0.361 | 0.020 | 0.017 | ||
| 2 spectra, SPPSALQTR | 0.000 | 0.052 | 0.023 | 0.000 | 0.000 | 0.871 | 0.054 | 0.000 | ||
| 2 spectra, FLPPPSLPR | 0.004 | 0.170 | 0.000 | 0.169 | 0.000 | 0.657 | 0.000 | 0.000 | ||
| 1 spectrum, LNAIEPEIGDYR | 0.000 | 0.081 | 0.069 | 0.006 | 0.000 | 0.843 | 0.000 | 0.000 |
| Plot | Lyso | Other | |||||||||||
| Expt C |
4 peptides |
8 spectra |
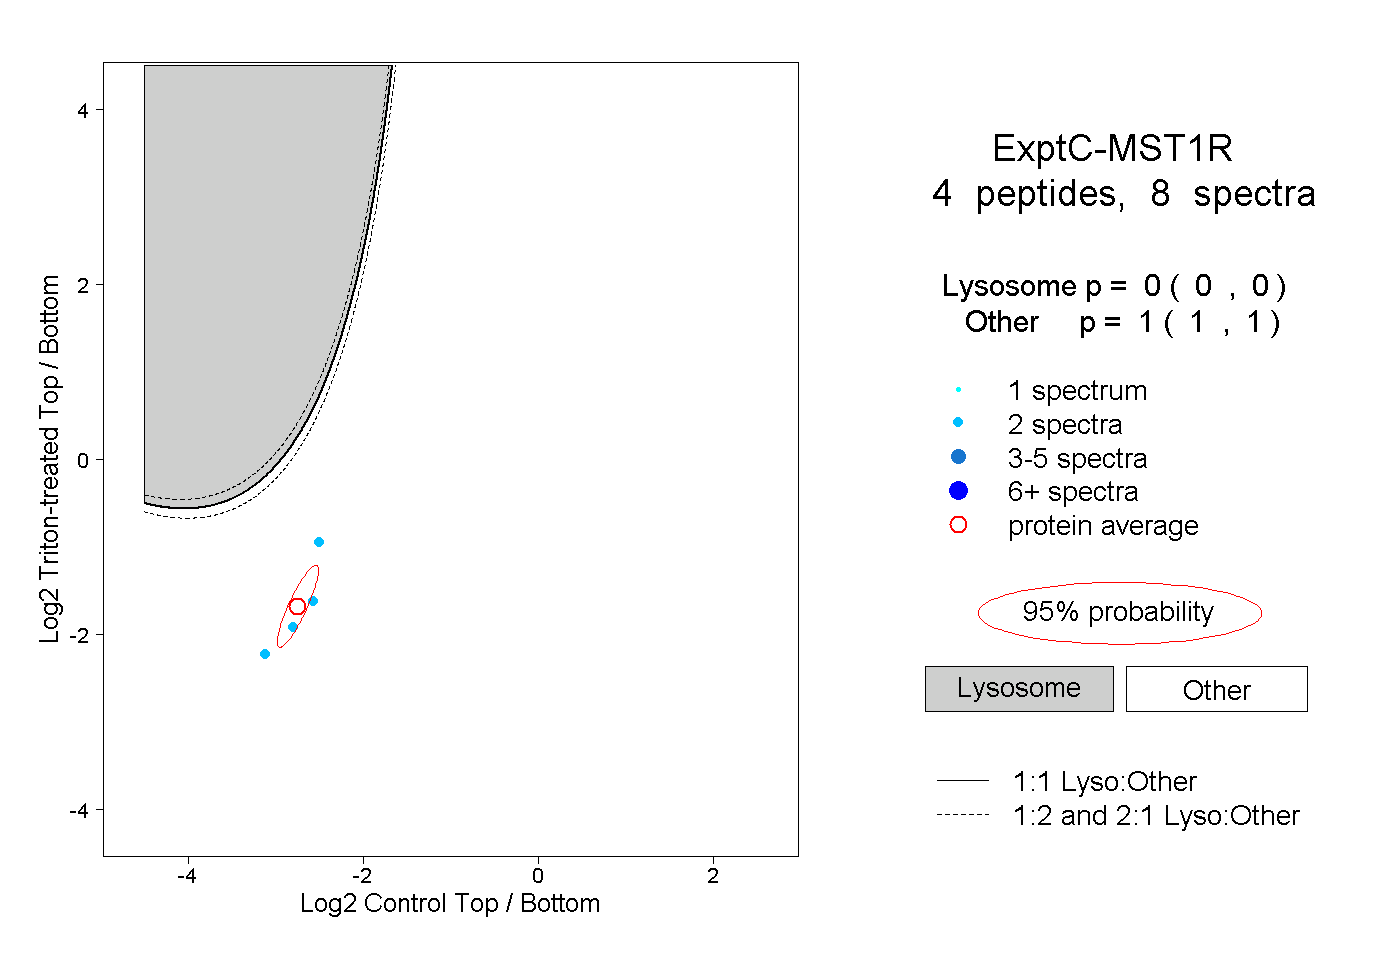 |
0.000 0.000 | 0.000 |
1.000 1.000 | 1.000 |
||||||||
| Plot | Lyso | Other | |||||||||||
| Expt D |
2 peptides |
2 spectra |
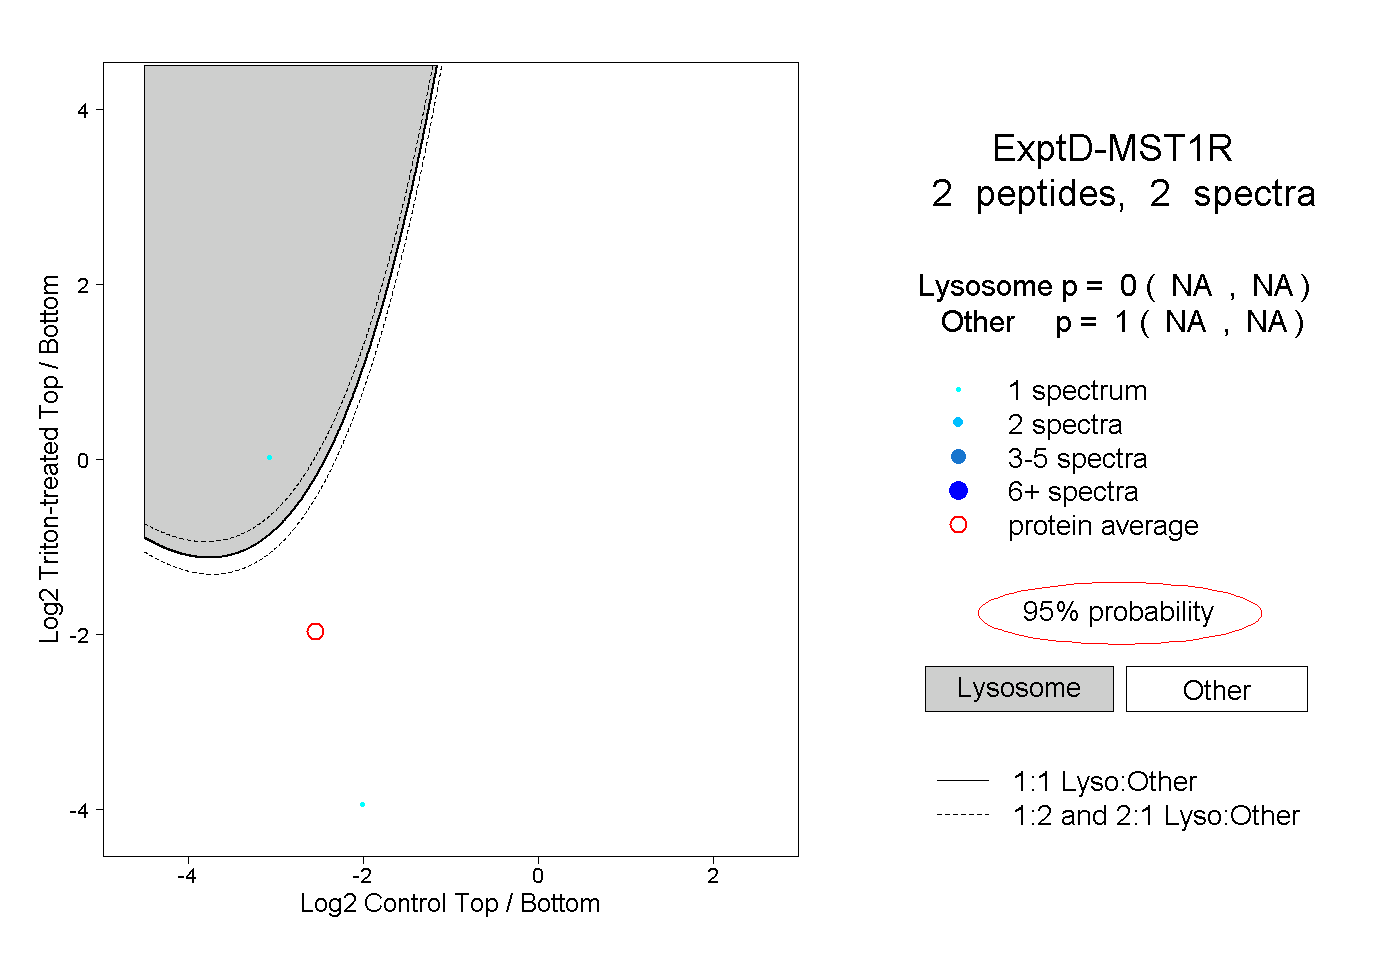 |
0.000 NA | NA |
1.000 NA | NA |